



Pendle’s price is currently at $1.52 and has shown a growth of 2 percent in the past 24 hours with $47.31 million in volume. The token was trading above $4 in Nov. but crashed down to under $1.20 in April and then has slowly built a support range between $1.00 and $1.65. Today Pendle has reached close to resistance, which has pushed sellers in previous months.
This development is significant as it occurs after months of stagnation. Following last year’s climb above the $4 level and a dramatic sell-off that pushed this RWA asset down by almost 70 percent, it entered months of sideways movement following a sustained downward trend. Rather than continue down, the asset slowly began to form support levels and established a trading range. This range is the most critical front for the bulls vs. bears battle.
Looking at the longer-term averages, we see a couple of slightly different stories. The SMA200 price sits at about $1.50, almost exactly where the token price is at now, suggesting that the asset has retraced back to its long-term mean price. The EMA200, on the other hand, is still considerably higher at $1.78, meaning Pendle is about 17 percent below its wider trend. This difference arises due to the EMA more acutely capturing the drastic fall earlier this year, whereas the SMA has caught up at a quicker pace.
The biggest challenge is still the eight-month resistance
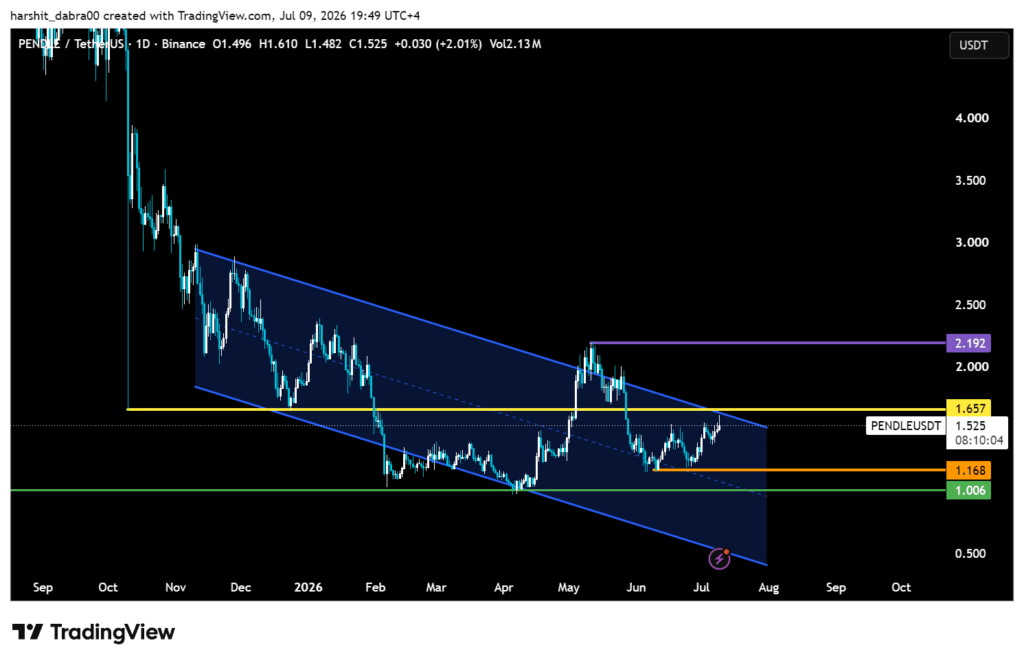
Ever since last November, Pendle has traded within a downward-facing channel. All advances during the previous eight months had seen sellers turn the price back away from the channel’s upper band. For instance, during the prior month of May, the price was at this same ceiling for no fewer than three sessions, the ultimate result of each test being a new turn lower.
Currently, that trendline is around $1.657, which isn’t that far from where the price is changing hands right now. A daily close above that trendline would be the first confirmed breakout from the channel on the day side since the formation of this channel. Although the breakout demands less than a 10 percent move, it is depicting more of a significant shift in market structure following several months of formed lower highs.
However, traders should be cautious on the buy side of this digital asset. Volume has reached $47.31 million at the time of writing and this is not quite impressive on the heels of a breakout attempt. Heavy trading on the way up traditionally accompanies solid breakouts, but that hasn’t happened yet. Without an influx of volume, there’s a possibility that Pendle encounters resistance again and is pushed down.
Support is clear as well. The first major support levels are located around $1.50, and this is followed by $1.35, and the last level is around $1.16. These are the levels buyers appeared in in the past. If these levels continue to hold strong, there is a high possibility of a recovery considering the levels from April.
The confirmation is still missing for Momentum
Short-term momentum is picking up and though the breakout is not confirmed, RSI7 of 65.39 is still below the overbought zone but the other two RSIs (14 and 21) are trading in bull territory. The MACD shows the bullish strength with the MACD line above the signal line; the shorter moving averages are still trading under the price, indicating buying control over the short term.
Considering it from the chart’s perspective, the confirmation is still missing. The Fibonacci retracements support at $1.35 & $1.31 provide a small area for retracements without impairing the ongoing recovery, while the $1.50 pivot converges with the SMA200 as a support area. Breaking the $1.657 level could offer a trajectory towards $1.79.
The important thing here is that until that happens, the marked is still hanging between a confirmed breakout and another rejection.


