



As of Wednesday, Bitcoin is being traded around $79,996 just slightly above that round $80,000 figure, after recording its largest single-day ETF outflow in the past four months. Now, one will immediately focus on the current trading price.
The more important figure to look at is the $635.23M that went out of U.S. spot bitcoin ETFs yesterday in one single session, which was the worst since January; this figure shows where institutional conviction is right now.
The ETF outflow breakdown
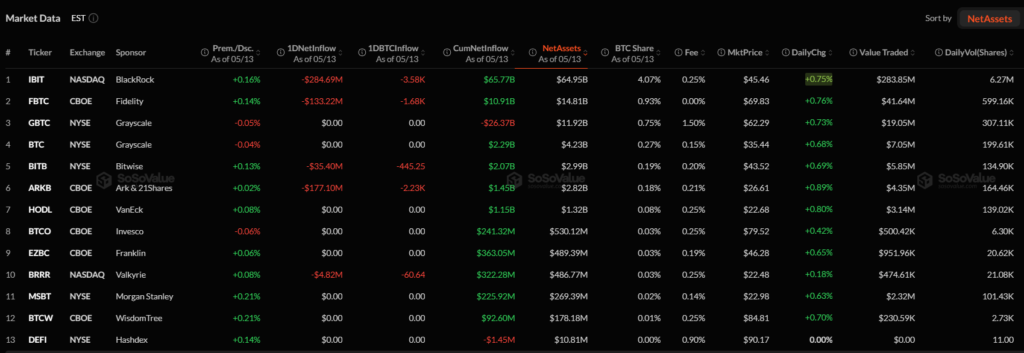
BlackRock’s IBIT had outflows of $284.69M. Ark 21Shares’ ARKB was behind this, with $177.10M, followed by Fidelity’s FBTC, which saw $133.22M redeemed. BITB saw further outflows of $35.40M. But the key observation here is that ZERO funds out of all US-listed Bitcoin ETFs recorded any positive inflow that day. That zero reading for all funds combined is where the signal lies and it’s not one fund adjusting positions; it is across-the-board, synchronized, institutional unease.
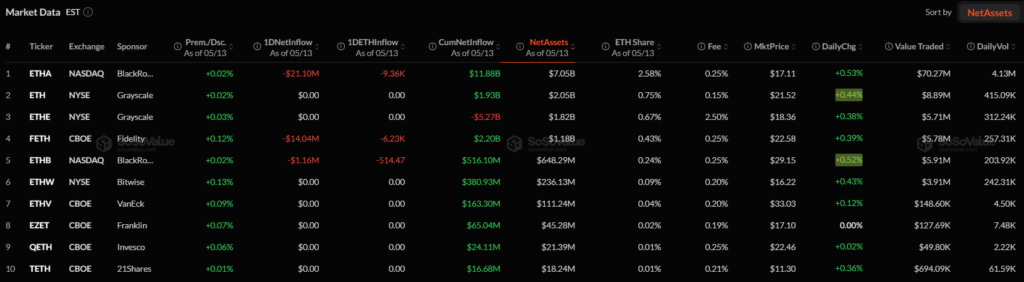
Spot Ether ETFs also performed in the same fashion, recording $36.3M net outflows over the same session as empty columns for inflow again. This, just after the robust April rally that saw that same group of spot BTC ETFs absorb almost $2B net inflow over a run. It took one macro print for that to reverse.
What triggered the exit
The U.S. PPI data came in at 6 percent on a yearly basis, beating forecasts considerably. This is a problem that Bitcoin-that has for the past months struggled to sell itself as a macro-hedge asset and not one of speculation-will face difficulties coping with, considering the decreased probability for upcoming FED rates cuts, tighter risk appetite, and a higher-for-longer environment for fixed-income alternatives to come forth in front of BTC.
To compound this further, the WTI crude futures were also still above the $101 a barrel level after the fresh U.S. Sanctions against the entities involved in the transfer of the Iranian crude oil to China were passed on Thursday. The oil prices, in turn, push the oil inflation stickiness argument, which is the biggest risk off-factor.
What the chart says and what it does not say
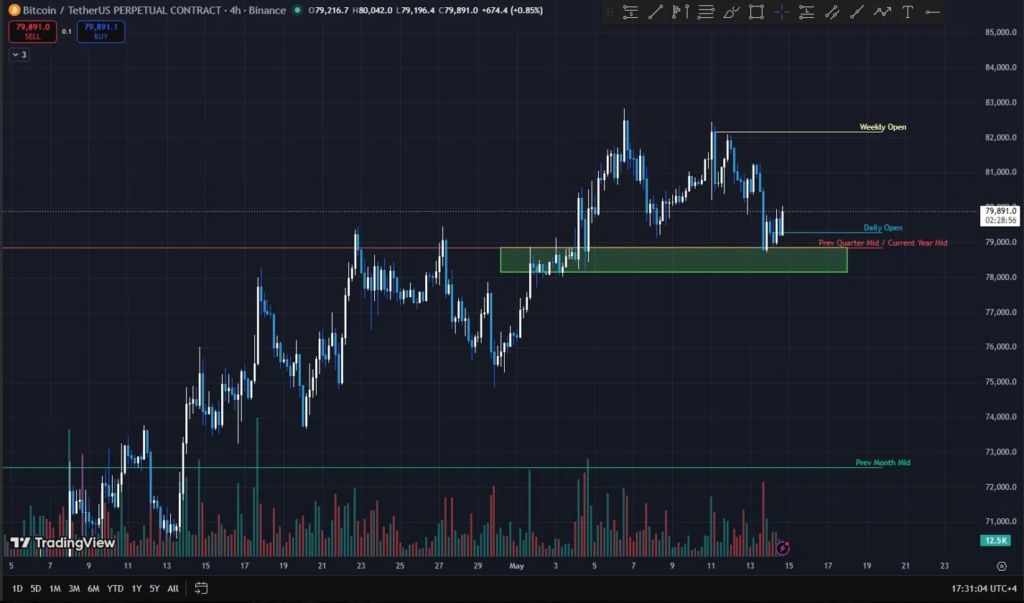
Regarding the 4 hr. chart of Bitcoin, currently the position is not a simple one to be aware of. We are currently $79,891 technically above the Previous Quarter Mid / Current Year Mid line at $79,000. We are also technically above the green outlined zone, around $78,000-$79,000. Since late April this green zone has provided demand/absorption during approaches multiple times and with the May 13 intraday low near $79,196 bouncing off this area, it does appear to still be providing support.
The Weekly Open is currently hanging around $82,000; the Daily Open is marked just below $79,300. We are now back above the Daily Open, a very minor and very short-term good sign, but we have not back above the Weekly Open, and thus that $82,000 area is still the immediate overhead resistance level.
The Previous Month Mid is much lower, sitting near the $72,600 area, which will serve as the wider macro support floor in the case of a breakdown below the $78K-$79K region.
What the chart does not say is that this rebound is fueled by demand again. Volume on the rebound is not remarkable, with the 7-day return and 24-hour return being -1.25 percent and -0.26 percent, respectively, and showing consolidation rather than accumulation. Long-term returns of 30-day and 90-day returns are +7.04 percent and +18.98 percent, confirming that the larger picture is still bullish, with short-term momentum flatlined at the macro level.
What this actually means for traders
The $78,000-$79,000 region has now become the boundary between near-term structure and it’s been tested and held. Close below $78,000 cleanly and with a large volume print would make the read change drastically with the next real structural support appearing only in the mid-70k as per the chart.
However, the good part is the recovery of $82000 (Weekly Open) is the minimum for the bulls to claim the current recovery leg is still in place. To drive to the next resistance at $85000, one must break $82000.
Currently at $79,996 the 1 year return is -23.13 percent, making this level at -36.61 percent ATH drawdown to the all-time high of $126,198.
This ETF outflow data is only significant when read in light of the following: its institutional products took in $2B in April; they returned $635M in a single session; the underlying asset hasn’t done much structurally. Either the demand zone at $78,000-$79,000 is much stronger than the outflow talks, or we just haven’t been tested yet.


