



TRON (TRX) has performed strongly over the past two months, rising by nearly 40%. Although the technical indicators signal that the price is overvalued, traders still believe that the token has more upside.
TRON forms the bullish double bottom pattern
TRON has been performing well since February and shows no signs of slowing down. The TRX prices rose from as low as $0.26 to $0.36, marking a 40 percent increase in its price. As shown in the chart below, TRX is currently forming a double bottom pattern.
A double bottom pattern is a bullish chart pattern that usually appears after a prolonged downtrend and signals a potential reversal in price direction. The pattern forms when the price drops to a support level, rebounds upward, declines again to a similar level, and then rises once more instead of creating a lower low.
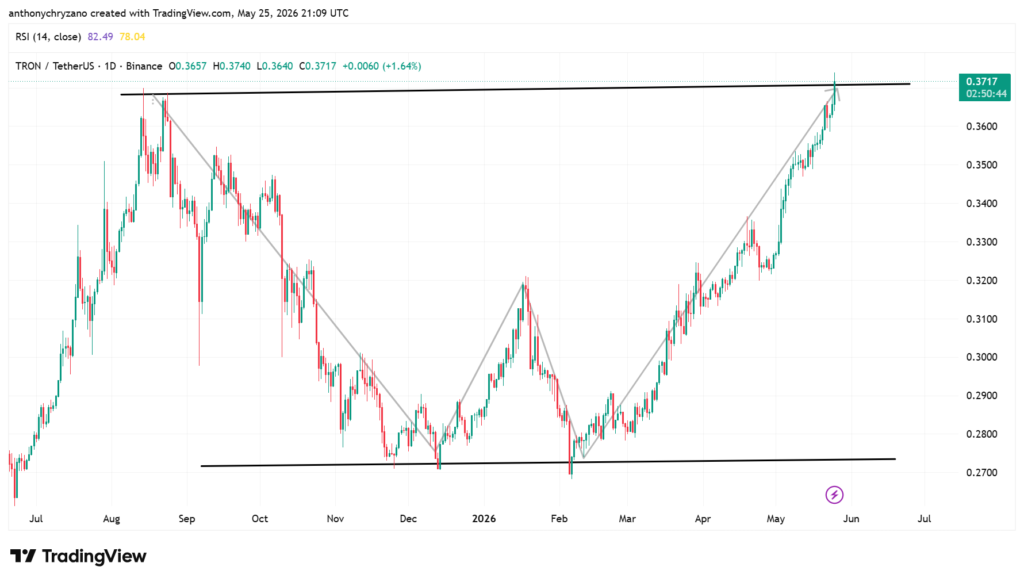
This creates a “W”-shaped structure on the chart. It is considered bullish because the second decline indicates that sellers are losing momentum and are unable to push the price lower despite another attempt. This often suggests that buyers are gradually absorbing the selling pressure and beginning to gain control of the market.
Once the price breaks above the resistance level between the two bottoms, traders often view it as confirmation of a trend reversal and a possible continuation of upward momentum. With TRX breaking above the neckline of the ‘W,’ the bullish momentum could continue.
Why? When a double bottom pattern is completed, the price typically breaks above the neckline (resistance level) that was formed between the two lows. This breakout is considered a confirmation that the pattern is valid and that the downtrend may have ended.
Once this happens, the price often starts to move upward with increased momentum, as buyers step in and short sellers exit their positions. This can lead to a short-term rally or even the start of a longer bullish trend, depending on overall market conditions.
TRX could hit value above $0.4 at breakout
Traders usually expect the price to rise by a distance similar to the height of the pattern (from the bottom to the neckline), which is often used as a rough target. However, the actual movement can vary—sometimes the price continues much higher if strong bullish sentiment and volume support the breakout, while in weaker markets it may only see a temporary bounce before consolidating again.
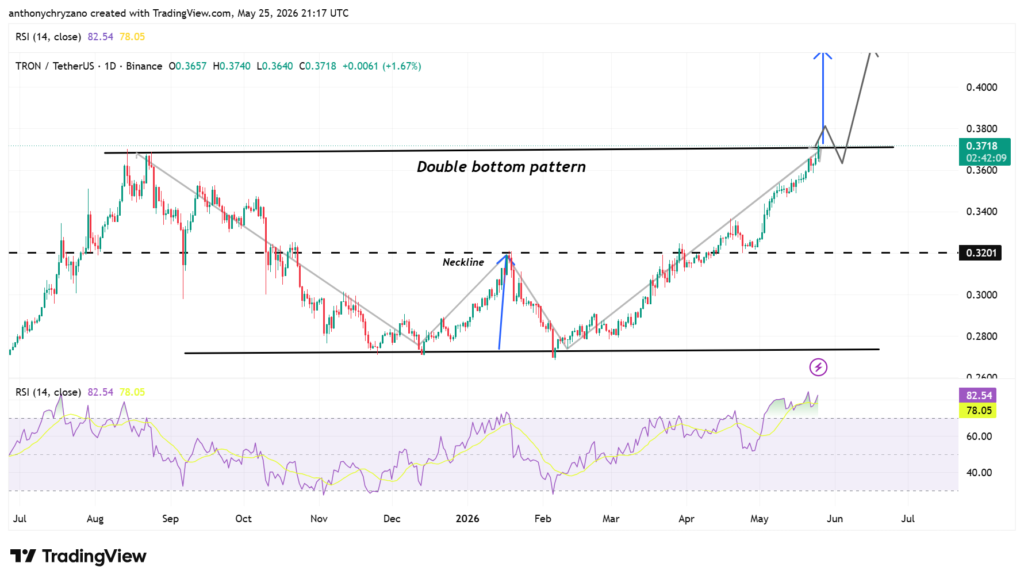
Although the relative strength index, which measures the price of the token and states if it is undervalued or overvalued, signals overvalued market conditions, the traders believe there is more upside to the token.


