

Solana price retests a key breakout zone as traders track whether buyers can defend support near $74-$77. The pullback follows a failed push through overhead resistance, and the next reaction could define short-term direction. Traders now eye $93 as the first upside level if the retest holds and momentum improves.
Solana price retests breakout zone near support
Solana price moved back into a zone that previously served as resistance before the latest recovery. The area now acts as an important support test for the market. A firm defense could support the view that buyers still control the local structure.
The current move follows a rebound from June lows, but resistance limited the previous weekly advance. Sellers pushed SOL lower after the price met an overhead trendline. That reversal placed focus back on the breakout area near recent lows.
Market participants now track the $74-$77 range because it aligns with the latest support zone. A trader known as Scient said he started adding size again at support. He also said he placed bids down to $74 as the retest developed.
Solana chart mirrors earlier recovery structure
Solana price has also drawn comparisons with its 2023 recovery structure. The earlier cycle showed a steep decline, a rounded base, and a strong rally afterward. The current chart shows another early base forming after a deep market decline.
Trader Ryker compared the latest structure with the previous cycle setup. He said he bought SOL at $40 during the last cycle and sold at $122. He also said he is waiting for another good entry before buying again.
The comparison does not confirm a repeat of the earlier cycle. However, it highlights why traders continue to follow the support retest. Solana price needs to hold the current zone before the 2023 comparison gains more weight.
Solana price has a clear short-term level to recover if buyers defend the current range. The first major target sits near $93, based on the charted recovery path. A move into that area would require stronger demand and a clean break above resistance.
The broader chart also shows a higher upside region between $115 and $127. That zone remains distant while SOL trades near the breakout retest. Therefore, traders view $93 as the more immediate level before larger targets matter.
However, the downside structure still carries risk if support fails. A loss of the $74-$77 zone could expose the $66-$68 area again. Solana price would then need fresh demand before another recovery attempt becomes clear.
Market data shows mixed demand around SOL
Solana price fell 3% on Wednesday as the bearish reversal extended from the prior resistance rejection. The decline also came as institutional inflows cooled during the latest session. Reported inflows eased to $1.67 million on Tuesday, showing weaker short-term allocation.
Open Interest also declined, and funding rates moved unevenly across the market. Those signals showed mixed retail positioning during the pullback. As a result, traders focused more on price reaction than broader positioning data.
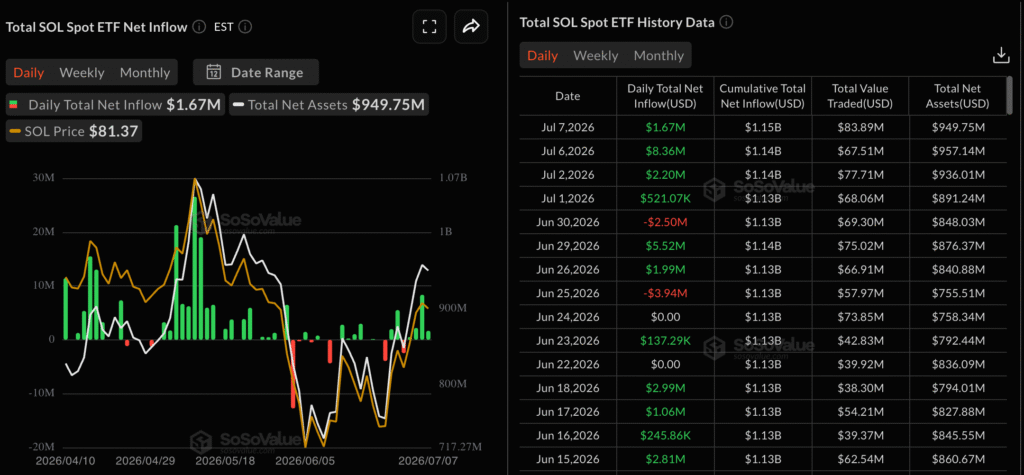
Source: SoSoValue
The technical outlook stayed weak while SOL traded near the 50-day Exponential Moving Average. That average sat around $76.67 during the latest setup. Solana price could face deeper pressure if it breaks clearly below that level.
For now, Solana price remains centered on the breakout retest near $74-$77. A strong reaction from that zone would keep the move toward $93 active. A breakdown would shift attention back to lower support before buyers regain control.