


Chainlink whales have gone on a buying spree, and the wallets holding more than 100K LINK have hit a new all-time high. With demand for the token surging, the prices continue to rise exponentially.
Wallet with $1 million hits all-time high
Chainlink whales’ wallets, each holding at least 100K LINK, have increased their accumulations, with the number of wallets holding 100K or more LINK reaching a new all-time high. The wallets with 100K LINK, worth nearly $1 million, have hit 805, rising by more than 8% over the past 7 weeks.
The increase in large investors increasing their exposure to LINK shows their confidence in the asset. Whale accumulation often indicates that major holders expect stronger price performance or future growth potential, especially when they continue buying during uncertain market conditions.
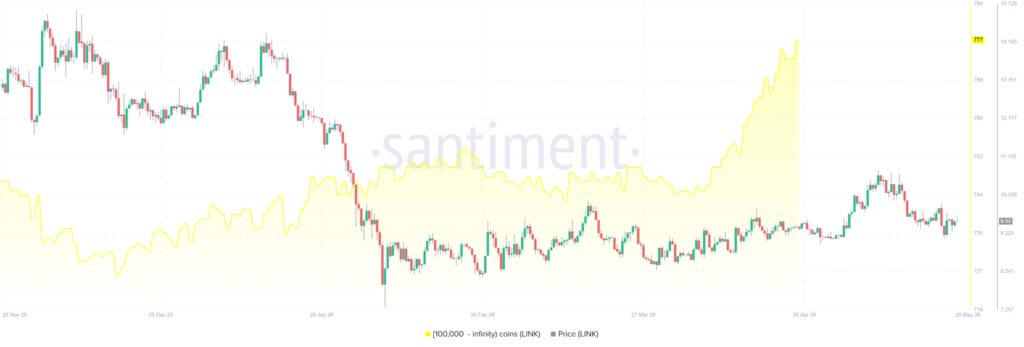
The increase in large wallets can also affect market supply dynamics. As whales accumulate and move tokens into long-term holdings, the amount of LINK available for immediate selling in the market can decrease. Lower circulating supply on exchanges, combined with steady or rising demand, can create conditions that support higher prices.
Whale accumulation is interpreted as smart money positioning
In addition, market participants closely watch whale activity because large holders can influence trends and sentiment. When traders notice an increase in whale accumulation, many interpret it as a sign of institutional interest or smart-money positioning, which can attract additional buyers and strengthen bullish sentiment around LINK.
However, while whale accumulation can be supportive for price action, it does not guarantee an immediate rally, as broader market conditions and overall investor sentiment still play a major role.
LINK saturates below $9.50
The whale accumulation is not portrayed on the chart shown below, as the price is still struggling under the 50-day moving average, a short-term indicator. Priced at $9.54, LINK has gained just above 1% during the past 24 hours. Even the relative strength index indicator is at 47, indicating that the market is saturated.
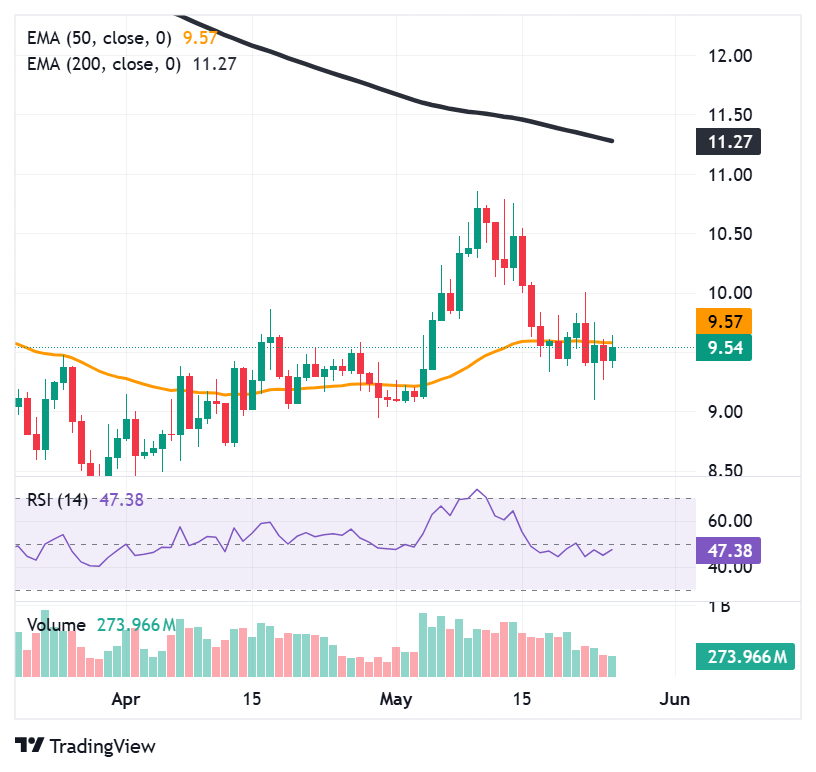
Although the price action might make it seem like Chainlink is not actually performing well when viewed with a squinted eye, the broader picture shows that the price is rising exponentially. The price action from February highlighted in the chart below shows how the LINK added value.
Chainlink hangs at parabolic curve edge
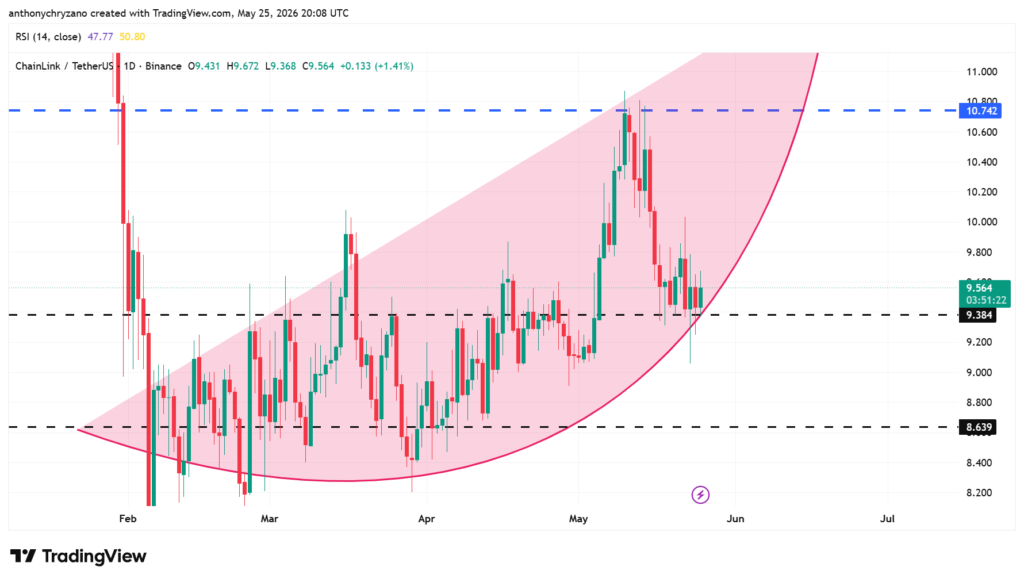
The price rose from as low as $7.8 to above $10 in just a couple of months. This price appreciation can be broken down into two categories: the rebounding phase between the $8.60 support and $9.30 resistance level and the breakout phase above the $9.30.
During the rebounding phases, there was immense activity at the support and resistance level. The bulls and the bears had their fair share of the market at their respective levels. However, once the prices fell below the $8.6 level, the bulls set in and pushed the prices higher, comprehensively making higher highs and higher lows. And this action causes the prices to rise exponentially.
But now, the Chainlink prices are at a crucial level, as they are nearing the edge of the parabolic arc, as shown in the chart. If Chainlink is to hold this parabolic shape, it should once again rise again and hit the $10.70 level in the next few days. If not, the parabolic shape will be dismantled. However, the dismantled shape does not mean the bullish momentum has faded.


