Chainlink (LINK) has crossed a major resistance after more than 8 months and a few failed breakouts. LINK breached this level with the help of whales who started to gulp up coins as they saw potential in LINK after the Perpetual Exchange GMX launched 24/7 WTI, Brent, and natural gas markets on the Chainlink network.
Whales went into a buying spree, which helped the LINK cross a major resistance level, as shown in the chart below. An analyst who goes by the pseudonym CryptoBusy observed that the 1 million LINK coin holder cohort made a sharp rise, giving a boost to the prices.
GMX perps markets gives LINK a boost
The rise in whale activity comes with GMX launching 24/7 perpetual markets for WTI Crude Oil (WTIOIL/USD), Brent Crude (BRENTOIL/USD), and Natural Gas (NATGAS/USD) on its permissionless perpetual exchange this week. The new markets are tradable using WETH and USDC on Arbitrum and are powered by Chainlink Data Streams for real-time pricing. The whale’s buying LINK at this particular time is no coincidence. This is how smart money positions itself before the rally.
As shown in the chart below, LINK prices have been on a downward trend since last August. LINK has been losing value since it reached prices above $25 in the last quarter of 2025. When considering the price action, LINK has lost more than 65% of its value during the past 8 months, as it currently trades at just above $9.
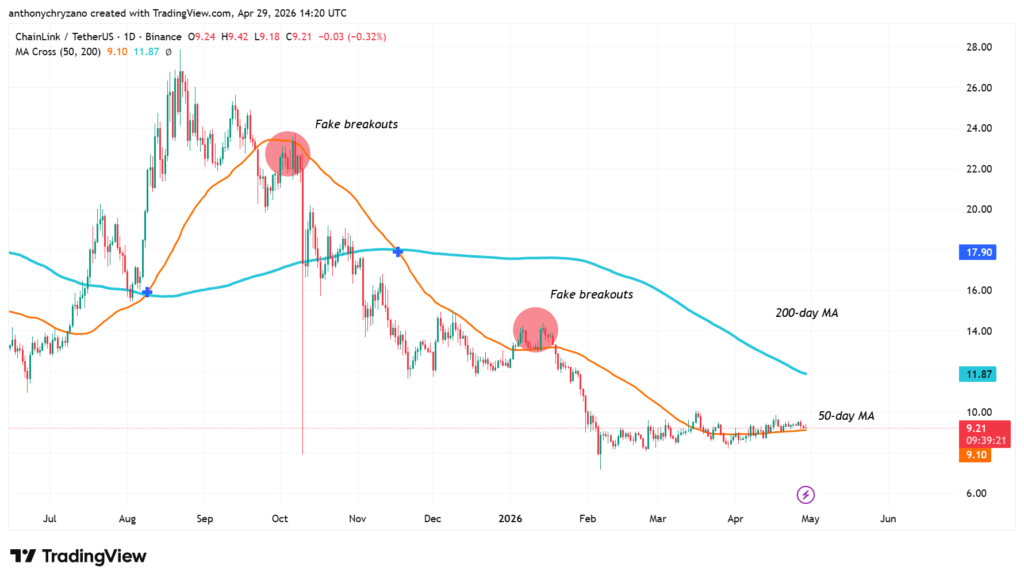
During the descent, the price breached many support levels, including the 200-day moving average (MA) and the 50-day moving average, which are considered important indicators in the crypto market.
Why is the 50-day and 200-day MA considered important?
The 50-day moving average and the 200-day moving average are two of the most commonly utilized technical indicators in finance and cryptocurrency trading.
The 50-day moving average shows the trend in the middle-term range based on the behavior of prices for about two months ago, while the 200-day moving average shows the trend in the long-term range and is observed by major market players. In other words, the 50-day moving average shows momentum, while the 200-day moving average shows the trend.
When price action is above these moving averages, the market usually interprets it as an indication that buying pressure is dominant. In addition, it could also mean that the trend might be changing from bearish to bullish.
Just like the bulls kick in when the prices are above the MA, when prices fall below these averages, it signals weakness and suggests that sellers are in control, with the moving averages acting as resistance levels that cap upward movements.
Is this a fake breakout or a real one?
Now that the prices have recovered above the 50-day moving average, LINK’s prices are starting to look bullish once again. But the chart below shows moments where the LINK prices had a spontaneous spike above the 50-day MA but were not able to keep the momentum, as it was merely hype and not real bull activity. So it is important to distinguish between fake breakouts and a real bullish momentum-driven breakout.
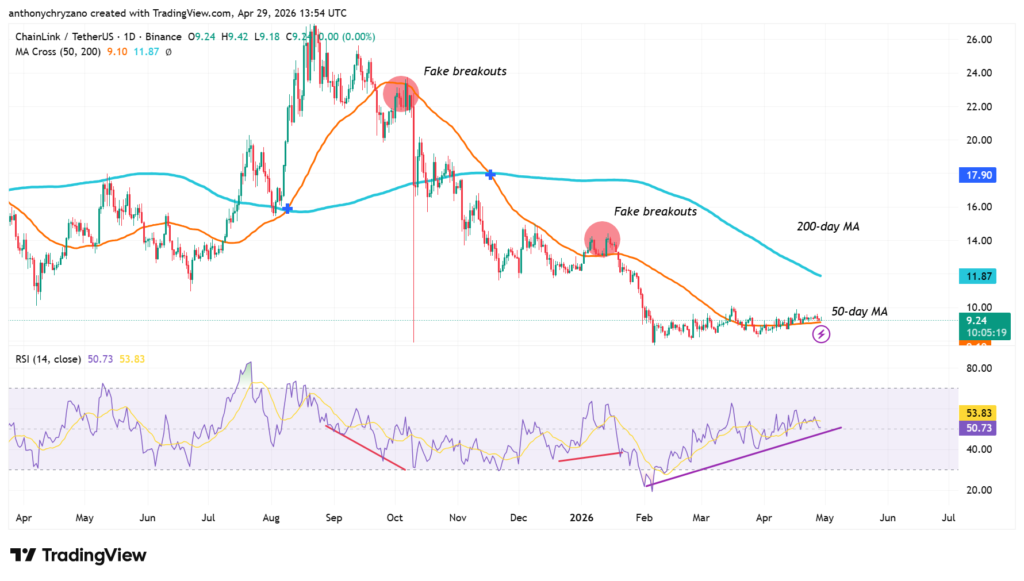
For instance, the behavior of the relative strength index at the bottom of the chart can be used as a measurement stick to gauge the strength of the market. During the fake breakouts, the adjacent RSI values were not convincing; there was not a period of an uptrend where the RSI made higher highs and higher lows.
However, this time around, it is not a fake breakout, as the RSI has made a series of higher highs and higher lows before LINK crossed above the 50-day MA, and it is continuing this uptrend even after breaching this level. This evidence substantiates the case for a sustained bullish trend.
A golden cross appears on the horizon
On top of that, there is another sign that shows the bullish momentum is heaping up. The 50-day MA is approaching the 200-day MA from under it. If these two intersect, there will be a golden cross.
Traders focus especially on critical crossovers, like the “golden cross,” which occurs when the 50-day moving average moves up above the 200-day moving average and may mark a possible move into bullish territory, and the “death cross,” which occurs when the 50-day moving average moves below the 200-day moving average and may suggest a possible bearish move.
If the stock price is higher than the 50-day moving average and 200-day moving average, it is likely in an uptrend, and traders will tend to go long.
While these are lagging indicators and can give off misleading signals at times, their significance comes from their usage.
Another important way to establish the bullish scenario is by looking at the higher time frame chart. Sometimes, although the short time frames could show bullish momentum, the higher time frames might not reflect it. This happens because there is so much noise and wild fluctuation on the short time frames. As such, it is a good practice to look at the higher time frames.
LINK establishes its bullish momentum on higher time frames
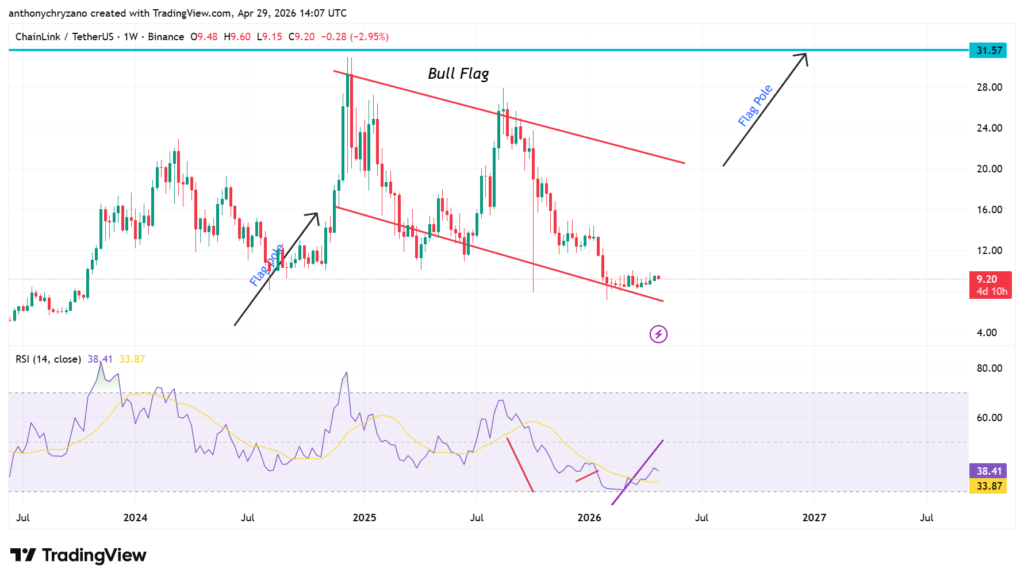
On the higher time frames, LINK is trading inside a bull flag. A bull flag is a bullish continuation pattern that appears during an uptrend when price pauses briefly before potentially continuing higher.
The formation takes place after a sudden surge upwards, referred to as the “flagpole,” after which there follows a short period of consolidation where the prices will consolidate in a narrow range either sideways or moving slightly downwards in a channel shape, forming a flag.
This consolidation shows temporary equilibrium in the market since there are sellers taking profits while at the same time buying from the new investors but at a more moderate rate. This pattern is very significant to traders since it shows that the bull market momentum is alive.
From a trading point of view, the initial surge will be caused by robust buying pressure or catalysts in the market. The consolidation will mean that the traders who have entered their trades take profits, resulting in a little sell-off but not enough to reverse the trend.
As the bull flag pattern matures, the volume will reduce during the consolidation stage and increase again as the price reaches close to the breakout level. The breakout of the pattern will take place when the price moves out of the flag pattern upwards and past its upper resistance with high volumes. As such, once the bull flag is completely formed, there is a high chance that LINK will hit prices above $30.