



The typical trader tends to get emotionally charged by one or two data points (funding spikes, depleting exchange reserves, etc.) despite exchanges usually sending out at least six signals at a time and often sending mixed signals (or none at all). The Exchange Intelligence Composite Score averages the six data points of exchange Bitcoin reserves, exchange funding rates, exchange liquidation asymmetry, exchange net USDT flows, exchange open interest momentum and exchange taker buy aggression into one overall score that is scaled between 0 and 100.
By using a seven-day moving average to reduce the impact of day-to-day noise, one is less focused on a single noisy metric and can get a clearer picture of risk in the markets.
The importance of multiple indicators
Each of the six metrics gets an independent score, which gets averaged to determine the final number. A taker buy Z-score of more than 2 or a 15 percent weekly jump in open interest, which both represent rising leverage, gets an 85. In the spot market, when BTC reserve climbs by more than 1.5 percent as BTC inflow from USDT continues to soar, these could be the precursors to some selling in the market, though no single metric alone is enough to warrant being in the red zone for the composite.
For filtering out the false alarms, that design helps to sort it out by requiring multiple signals to align before the market goes into the overheated state.
The process followed to identify high-risk markets
With a combined crossing under 65, the market moves into a high-risk regime. Over 80 is the figure that shows a high degree of risk; on the other side, values under 25 can be considered the lower-risk bullish territory in which we are seeing leverage already being flushed out, funding flip negative, and asymmetric opportunities having traditionally been printed.
A secondary warning siren works parallel to the index itself, keeping track of the number of components that individually exceed 60 at the same point in time. A cluster of four or more are signals that a majority are leaning bearish.
The rarity of that alarm is being depicted from the daily chart
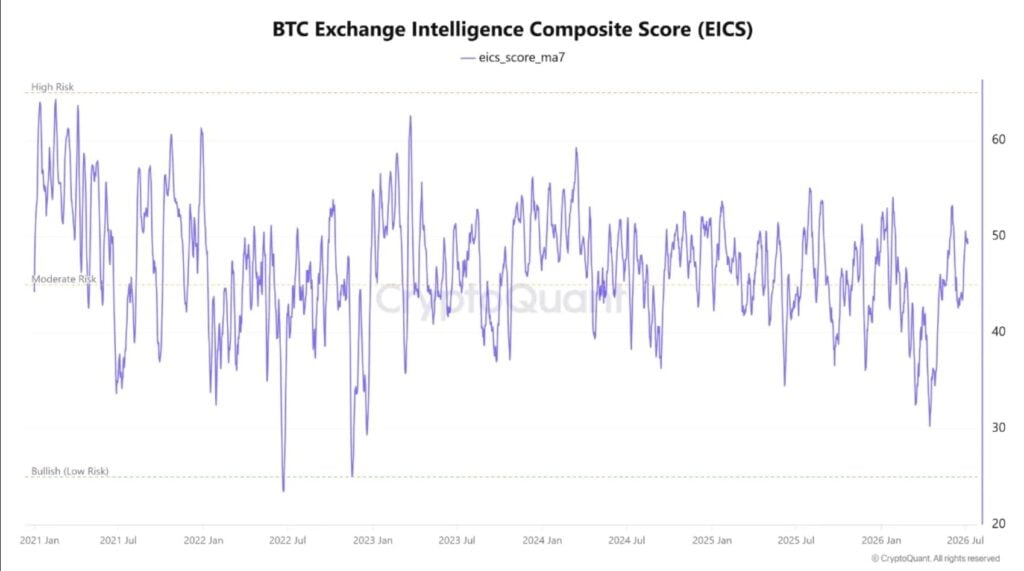
The BTC Exchange Intelligence Composite Score chart going back to 2021 depicts the smooth average oscillating between the mid-twenties and low sixties for five consecutive years as well as never settling for long.
It dropped into the zone of low thirties during the time of early 2026 and climbed back up to near 50 by the middle of July, similar to Bitcoin’s exact price round trip from its June lows.
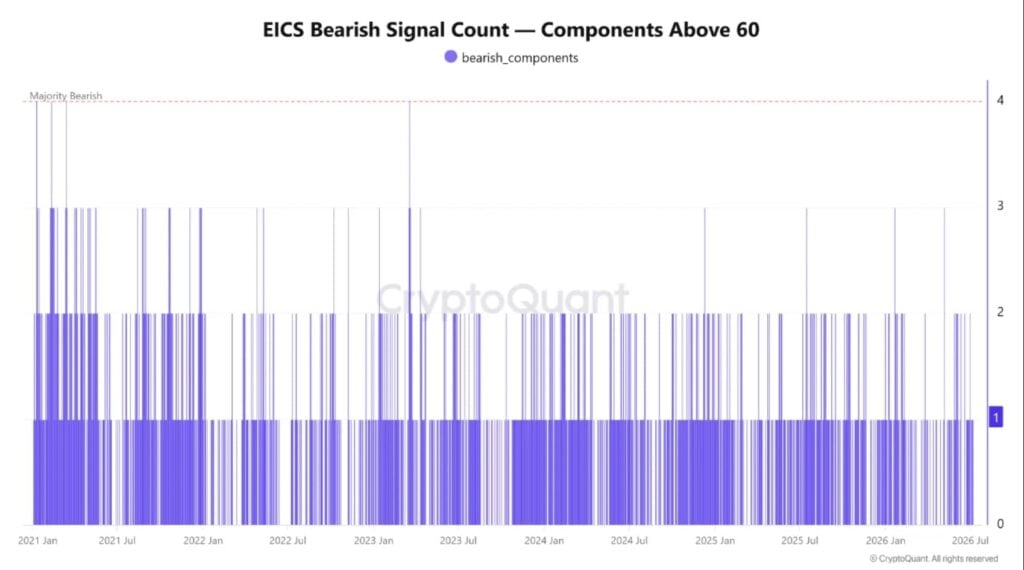
The above attached chart counts how many of six signals at once have gone red. More than four signals having gone red indicates the real danger that has precipitated a lengthy squeeze, something that has been seen only twice in five years, both during 2021, and once in early 2023. Since then the chart hasn’t approached those extremes, and the vast majority of its peaks correspond to the crossing of only one or two signals and never more; indeed, throughout 2026, the total never exceeds two signals.
The crucial takeaway here is that the big danger alarm has stayed on the silent side for three straight years even in the times of high price fluctuations. The funding and reserves were shifting on the one side with the prices swinging on the other. None of that was indicating trouble at that same point.
The entire design was tested by one spike in April
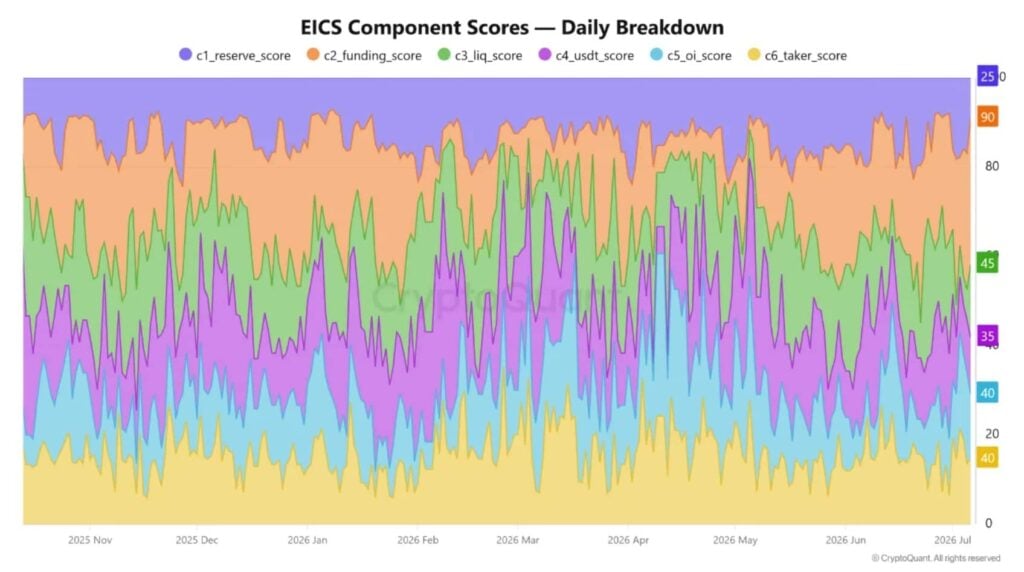
Open interest recorded the biggest spike out of the six indicators in April, although the composite score has shown minimal movement, and all of this is because funding, reserves, and taker activity stood on the stable side. This result shows the reason why the model is relying on multiple signals in comparison to reacting to leverage alone. Based on the composite standing around the figure at 50, the market is still in a neutral zone, more so than a high-risk one.
The key here is to note whether funding starts pulling the other indicators on the higher side or goes for a cooldown.


