



While having experienced its highest period of network activity for 2026, Aptos still hasn’t felt any benefits from its network activity. While there is a clear trend between increased on-chain activity and low market performance, the community and traders pay close attention to the project because transactions performed on the platform increase rapidly, like never before.
In just the past week, Aptos witnessed around 78.8 million transactions, which has been the highest number of transactions in the current year for the coin. As the number of transactions continues to increase at an impressive rate, it indicates that user participation is growing significantly behind the scenes.
Transaction activity is a reflection of the performance of the network
On the crypto exchange platforms, the number of transactions made can be considered one of the most straightforward ways to gauge the performance of a blockchain network. With a blockchain experiencing increasing transactions, this usually means that more people, projects, and capital are involved in the network. Over the long term, this pattern of development may enhance investor trust as there is evidence of genuine demand for the asset.
Network activity and price are positively correlated
Traditionally, there is a positive correlation between activity and price. When activity within the network increases, the value of the ecosystem tends to be valued aggressively by investors based on the premise that increased adoption would lead to increased utility, fees, and developers’ interests in the future. Price usually increases after activity increases since the market starts to factor in growth potential.
But that is not always an instant reaction. There will be times when fundamentals and price become detached from each other, especially when there is overall uncertainty in the market or consolidation is taking place. It seems like that is what Aptos is going through at the moment. Although network traffic is increasing, the token itself is still struggling to breach resistance levels.
Although the blockchain itself may witness an explosion in transactions, even that may not be enough to convince the investors to venture into risky ventures as long as the entire market is on guard.
Psychology of traders can delay market reaction
The other thing to consider is the psychology of traders. Markets need to see some validation before they respond to the numbers being seen on the chain. While the increase in transaction numbers can be seen as positive, they will likely want to see a strong breakout before jumping in.
At the same time, some speculators are interpreting the current setup as an accumulation stage for Aptos. If network metrics rise while the price remains unchanged, then this may indicate that the network is improving under a relatively underappreciated market. Past examples in cryptocurrency history have shown how such divergences have resulted in delayed price action once sentiment improves.
The consistency of Aptos’ transaction grActivity, in contrast, has been trending higher consistently for multiple months, reflecting genuine use of the chain in question and not speculative interest alone. This type of growth is considered more healthy for the ecosystem to develop over time because it is based on repeated use and not sporadic transactions.
For the time being, Aptos finds itself in a state where its fundamental performance appears to be better than the performance reflected in its price action. It remains to be seen how market sentiment plays out and whether rising transaction volumes become a predictor for the future. Until then, the network continues building momentum underneath the surface while price struggles to fully acknowledge the scale of its on-chain growth.
Aptose trades inside rising wedge
Meanwhile, APTOS price is fluctuating inside a rising wedge. A rising wedge is a technical chart pattern where price moves upward inside two converging trendlines, with both the highs and lows continuing to rise but the range between them gradually narrowing. Even though the price is still climbing, the pattern is generally considered bearish because it often signals weakening momentum and a potential downside breakdown.
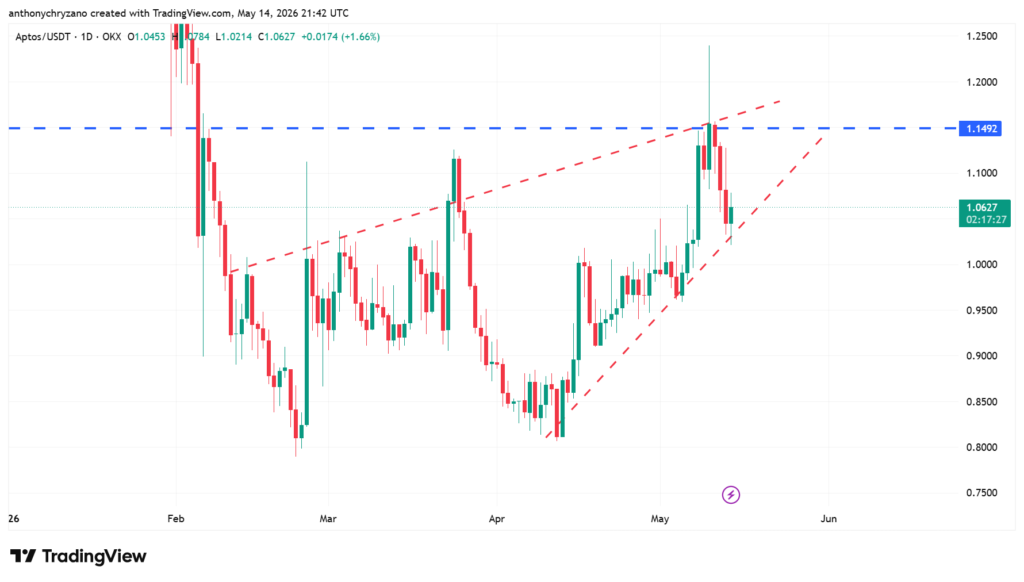
The formation takes place when sellers keep driving prices higher; however, the new rally is always less strong compared to the last rally. In that case, prices form new highs and new lows, but the slope of the rally decreases. The wedge pattern emerges in this way: the market appears bullish at the top line, but buying interest fades inside.
Within the pattern, the behavior of the traders starts changing. At the start of the move, enthusiasm among buyers is high and momentum is strong. But as the formation progresses, sellers begin defending higher levels while the buyers find it hard to keep their enthusiasm at the previous level. There is typically lower volume in this stage.


