The Layer 2 (L2s) thesis still holds but just from the technical perspective, they might be unnoticed. The technicals of the top five L2 adjacent assets (market cap) are mixed; some are range-bound, some are actively breaking down, and precisely zero are trending up against the 200 day moving averages.
Mantle (MNT)
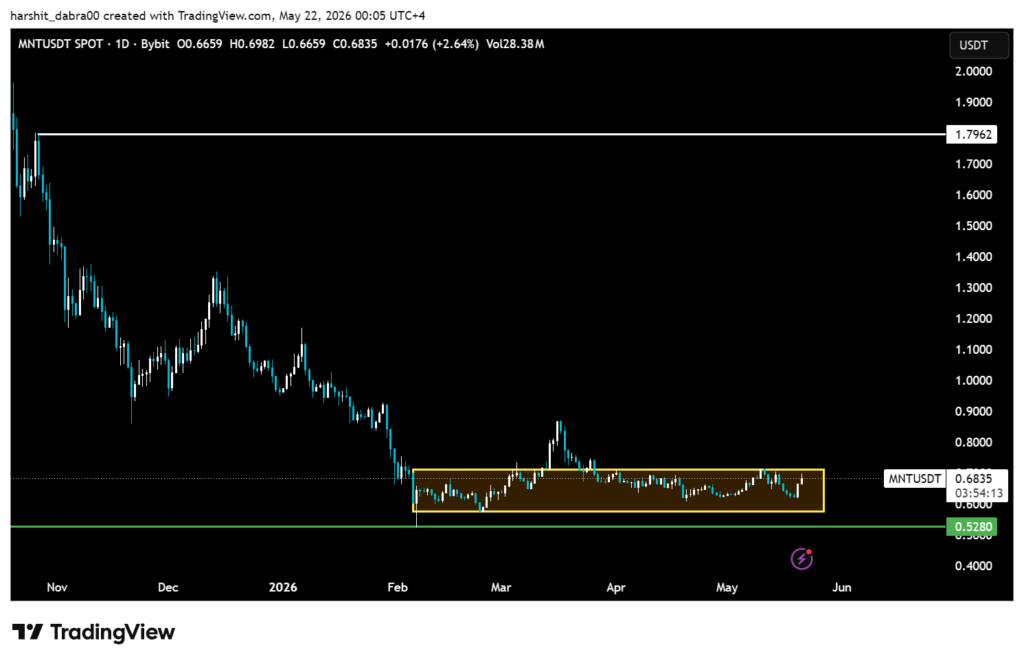
Mantle is up 5.93 percent today at $0.6835 and seeing a volume of $50.28M in 24 hours. Its market cap is currently $2.25B. While the daily bounce appears steep on its own, the 7-day performance (-1.33 percent) confirms this is a rangebound recovery, not anything new.
Here, the structure is complex. MNT is trading above the 7-day SMA ($0.6507) and 30-day SMA ($0.6529), which is bullish in the short term; however, it is 20 percent below its 200-day MA at $0.8516. This is the primary structural point of importance and it really dwarfs any action in the daily chart. Any fluctuations in the daily chart should be considered nothing more than “noise” against a longer-term trend that has not abated.
The Fibonacci levels off the 30-bar swing create logical resistance at the $0.665 to $0.69 area and this is exactly where we are trading at the moment. The 61.8 percent retrace is at $0.654 while the 50 percent retrace is at $0.666. We have MNT stuck in between these two levels. RSI at 51.72 and the barely negative MACD histogram at (-0.00316) reflect neutral momentum; we have no major hands trying to push this in either direction.
OKB

OKB at $81.05 is relatively stagnant on the day (up 0.11 percent) but weekly has a drop of -5.14 percent, which does show the current situation more closely. Trading volume at $18.69M on a $1.70B market cap is weak and the MA stack continues to reinforce the bear position: price is below the 7-day SMA ($82.58), 30 day SMA ($84.44) and 200 day SMA ($96.24) and every single MA point is above price.
The interesting part here is that RSI is 37.60; this is not “highly” oversold but it is close enough to the 30 marker that a technical bounce is statistically possible. The MACD histogram is the lowest point in this group at -0.696. Bearish momentum is definitely present and now it is whether this is winding down or merely pausing
Polygon (POL)
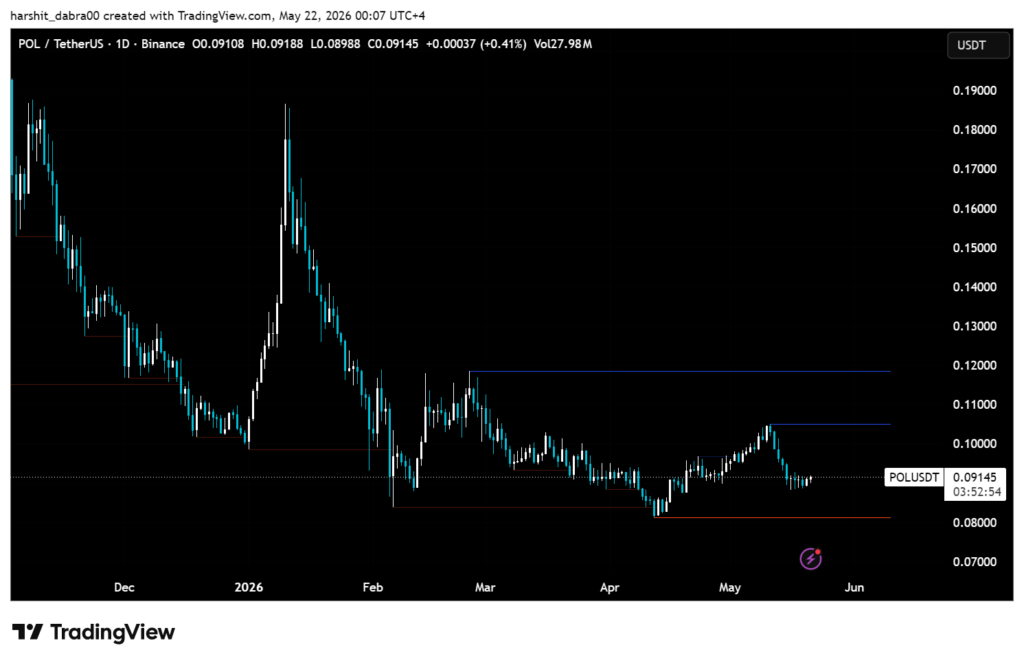
POL is trading at $0.091, down 3.87 percent for the week with $970.6M market cap. The $51.31M in 24 hr volume is over 5 percent of the circulating supply active but is going nowhere with no direction following up. Price is under the 7-day SMA ($0.0912), 30-day SMA ($0.0952), and 200-day MA ($0.1132), bearing bearish across the board with RSI at 42.29 drifting down.
Support lies between $0.088 and $0.090 with the daily pivot at $0.09044. Getting back above $0.096 is a prerequisite for any bounce argument and the 50 percent Fib retrace level at $0.0966 provides the first actual resistance test. Below $0.088 the chart becomes relatively structureless until $0.079 to $0.080.
Arbitrum (ARB)
ARB has lost a whopping 14.39 percent in seven days, which is almost double the second worst of this grouping. At $0.114 it has a market cap of $718.9M. The $73.59M 24-hour volume is also the highest of all five of these coins and when the volume on a falling coin is the highest of a bunch, it’s two sides of the same coin. Either capitulation or distribution and it doesn’t tell us anything with the bounce of 2.35 percent.
Trading beneath the 7-day SMA ($0.119), 30-day SMA ($0.1265), and 200-day MA ($0.1571) while the RSI sits near oversold with a reading of 35.08. Immediate support to be held will be the pivot from $0.1114 to $0.1120. Beneath that low there is little structure with the swing low at $0.109. Resistance points and upside targets at $0.1294 and $0.1489, will be looking to retake an overhead MA stack that is completely above it.
Stacks (STX)
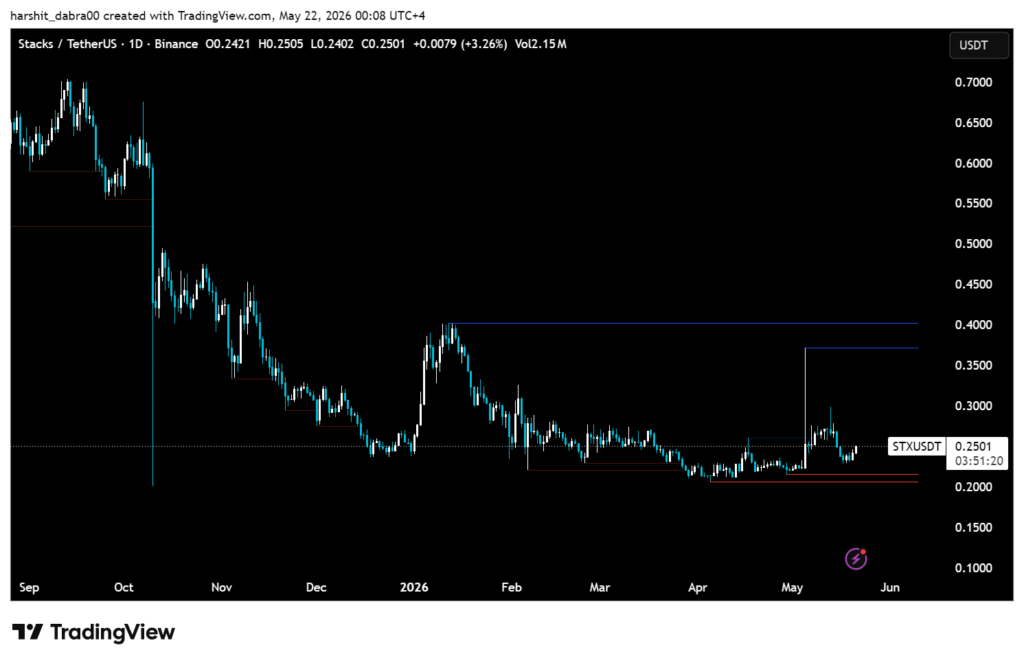
STX is sitting at $0.25. The most important figure is not the price but the volume during 24 hours. The volume is at $8.84M with the market cap at $451.7M. This means it trades less than 2 percent of its market cap per day, which is clearly the lowest conviction figure of the bunch. Low volume will make fake moves in either direction and makes it harder to maintain. Add to the picture that the token lost 10.23 percent in 7 days.
Interestingly, the shape of MA is quite flat on the short end. As the 7-day MA ($0.2432) is almost equal to the 30-day MA ($0.2408), it technically indicates no acceleration in the short-term trend and no reversal either. However, a flat MA in a wider downtrend (200-day MA $0.2787) is not the same as steady, for example. RSI is at 48.91, which is nearly neutral. And the MACD histogram shows -0.00332, a slightly bearish reading.