




Top 5 AI & Big Data based cryptos are again in the trending narrative. The current price action is failing to show is that four of the coins are overextended on the short-term RSI all at the same time, two are beneath the daily pivots and one is on the critical Fib level showing macd breakdown.
Bittensor (TAO)

TAO is trading at $325.20 with $352.6M in trading volume in the last 24 hours; this shows that the amount is the highest of the 5 given values. The moving averages are stacked accordingly: SMA7 is at $304.64, SMA30 is at $266.45, and SMA200 is at $269.17, where the shorter-term SMAs are placed on top of longer-term ones.
MACD suggests upward acceleration is occurring. It is on a reading of 12.87 for the MACD line (above the signal line, at 6.44) and is at 6.43 for the histogram. RSI7 at 73.14 has now broken into short-term overbought territory. RSI14 (66.06) and RSI21 (61.92) are up, but not extended. Divergence of the RSI timeframes may point to a near-term overbought condition but there is still room in the medium-term uptrend.
From a Fibonacci standpoint the structure is very clean about the next steps. Current swing was from $235.62 to $332.40. Healthy retracements should stay above the 50 percent ($284.01) and 61.8 percent ($272.59). These numbers also meet up with the SMA30 ($266.45) and SMA200 ($269.17), forming a strong cluster of support between $266 and $284. Extensions are currently sitting at 127.2 percent ($358.72) and 161.8 percent ($392.20), respectively.
NEAR Protocol (NEAR)
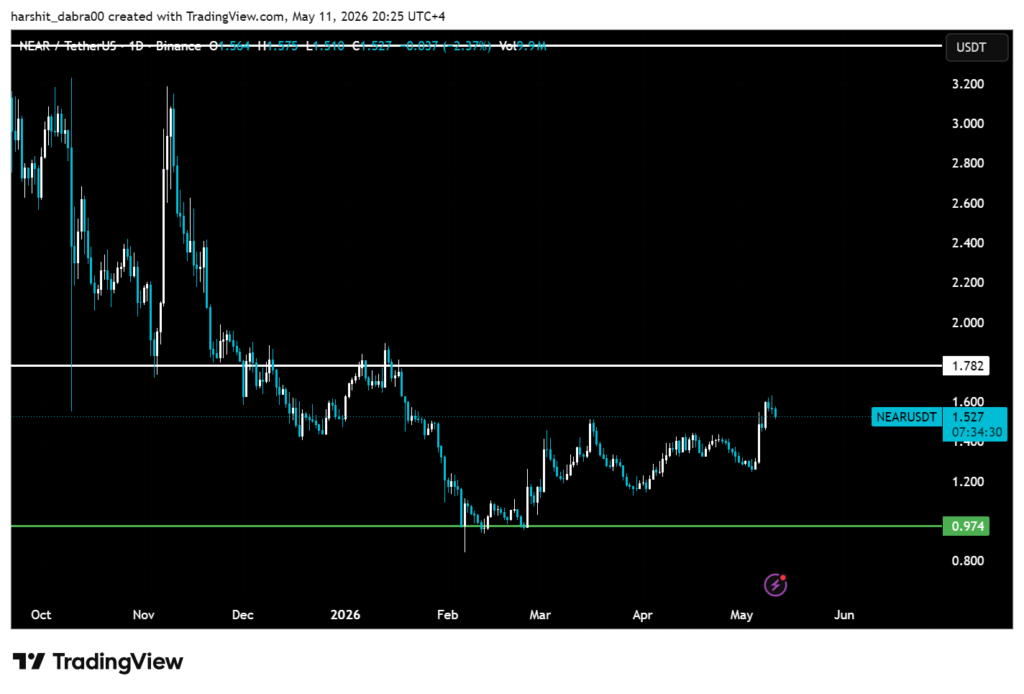
NEAR is at $1.527 and it has $243.54M daily trading volume at the time of writing. That is the second largest within this list. MACD histogram at $0.0268, positive and increasing; RSI7 has moved to $74.40 and it has constructive SMAs: SMA7 at $1.46 above SMA30 at $1.39.
However, both the SMA200 at 1.55 and the EMA200 at 1.57 are well above where the price currently is. NEAR has not yet reclaimed its long-term average. All other bullish signals in the set of data exist where the 200-day is serving as overhead resistance and not support and this makes a difference.
Fibonacci retracements from the 1.25 to 1.63 swing take a 50 percent retracement at 1.44 and a 61.8 percent retracement at 1.39. Both closely watch the SMA7 and SMA30 respectively and could be the natural place for NEAR to pull back to if it comes off its current RSI7 overbought condition. 127.2 percent extension at 1.73 and 161.8 percent extension at 1.86 would be the next two obvious targets for NEAR should it eventually get a convincing close above its 200-day average.
Internet Computer (ICP)

At the time of writing, the digital asset ICP is trading at $3.374 with $176.17M in volume. Short- and mid-term moving averages are bullish: SMA7 at $3.11 and SMA30 at $2.61. SMA200 ($3.18) and EMA200 ($3.12) are close to the current trading price and ICP is right on the average, rather than much above or below; that is, ICP is a crossing zone.
What is remarkable about ICP is the RSI profile. RSI7 at 71.04, RSI14 at 70.17, and RSI21 at 67.39. All three RSI numbers are high or overbought, which normally does not happen with all three shortest time windows extended at the same time. When a 14-day measure (RSI14) is already over 70, it means that the move extending higher is more than a day or two.
Using Fibonacci levels on the $2.32 to $4.07 swing, the 50 percent retracement is at $3.20 and the 61.8 percent at $2.99. These could be the near-term supports. The 127.2 percent extension at $4.55 and the 161.8 percent extension at $5.16 are the next upside levels if ICP gets through this overhead.
DeXe (DEXE)

DEXE is also trading well below TAO’s and NEAR’s daily volume, at $12.46 and only $13.78M. That will matter for interpretation of the technicals. Long-term technicals are still strong; SMA200 is at $5.59, and EMA200 is at $7.27-both still way below the price and show the size of the run already undertaken by DEXE. Medium term is mostly positive, with SMA30 at $12.02, EMA30 at $11.31.
The difference of DEXE from the rest of the group is the MACD. The MACD line is under the signal line, 0.3375 vs 0.4350 resulting in a negative histogram of -0.0976. RSI is in better shape than competitors. RSI7 at 64.66, RSI14 at 58.56 and RSI21 at 58.90 are all not overbought. This provides for more upside room on a momentum base if the MACD is able to reverse.
DEXE’s moves are easily faked in both directions due to the low volume. A sharp move has to be backed by volume for further confirmation.
Render (RENDER)

RENDER trading $1.96 at $96.47M volume. Both short-term and mid-term averages are constructive: SMA7 is $1.96, SMA30 is $1.84 and SMA200 is $1.78. However, EMA200 is $2.03 which is higher than the current price and above the current EMA7 ($1.96), suggesting some long-term overhead resistance.
MACD is positive, the histogram is at 0.0283, and the MACD line is above the signal at 0.0488 compared to the 0.0205 level. RSI7 at 70.79, which means it is overbought. RSI14 is at 63.49 and RSI21 is at 59.89 (these are considered medium).
The Fibonacci swing from $1.66 to $2.08 is where the 50 percent retrace is $1.87 and the 61.8 percent retrace is $1.82 which are initial support on any pullback. In terms of upside targets, the 127.2 percent extension is $2.20, and the 161.8 percent extension is $2.34 which will need to break through the EMA200 resistance level around $2.03.


