Monday saw Toncoin make one of its biggest single-session moves of the year, jumping 14.77 percent to $2.01 where it made its $2.198 high for the session on Binance, with the daily volume being 25.88 million TON. Superficially, it seems like a breakout, but there are deeper complications.
The intraday move was real, but context matters
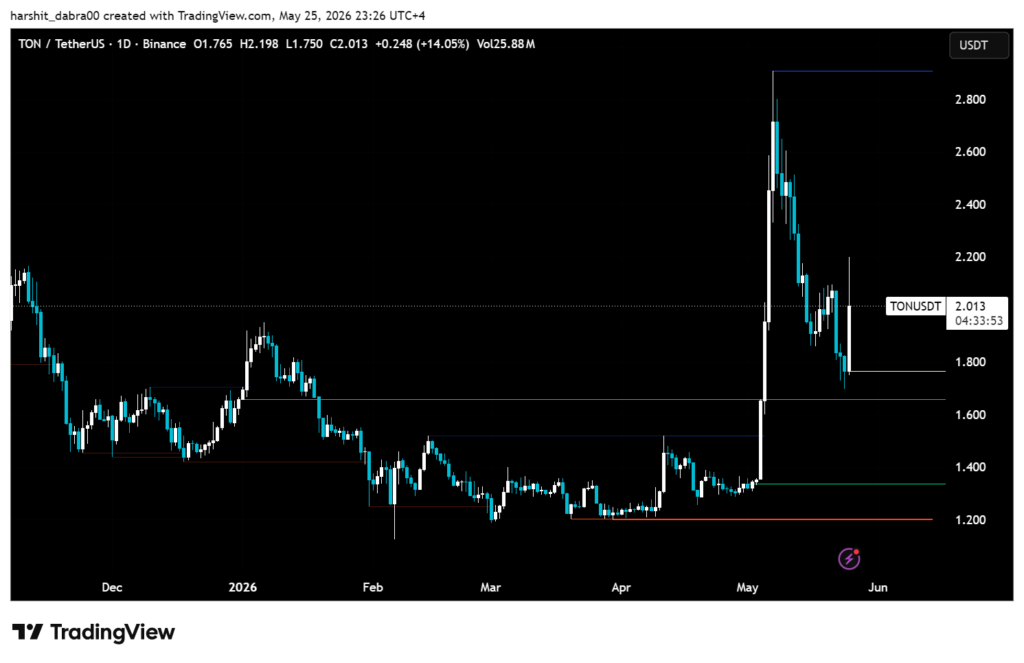
As seen in the chart TON has spent much of the period from the beginning of late April to the beginning of May slowly trading sideways between the $1.75 and $1.85 range (way below the $2.89 reached by mid-May) prior to this and the ensuing rapid multi-week dumping, which took the price down by nearly 40 percent by the time it opened up to Monday’s session at $1.765
So for the Monday candle, it opened at $1.765, ran to $2.198, found a low of $1.750, and trades now at $2.013 at the time of writing. That’s a 24.8 cent net gain on the day with the wick up at $2.198 before sellers put an end to it. Range on the daily bar alone, from low to high, was 44.8 cents or around 25.4 percent. It’s rare that the market participants will see such an intraday range based on simple buying pressure. Usually it is the sign of either a liquidating cascade driving shorts out or a catalyst-driven vol-spike or even both.
A 24 hour volume of $466.12 million seems high compared to the previous couple of sessions, confirming the move is real. It is not normal to maintain 14 percent moves on low volume.
Where the 1-hour and daily indicators diverge
This is arguably the most significant analytical piece of Monday’s setup and something most traders would miss focusing solely on one time frame. Everything is in an uptrend on the hourly as well. MACD at 0.0619 with the histogram at a +0.0303 suggesting acceleration is taking place of late. RSI7 sits at 84 and RSI14 is at 79.93 suggesting extreme overbought conditions short term. Moving averages are stacked up bullishly on the hourly with the EMA7 at $1.97, the EMA30 at $1.85 and the SMA200 at $1.93. The intra-day structure already crossed all near-term moving averages.
The picture on a daily basis is revealing yet another part of the story. The MACD line has dipped to 0.0460; however, the signal line is still higher at 0.1146 and the histogram is in negative Territory at -0.0686. This negative histogram suggests that the daily trend hasn’t quite caught up with the momentum seen on intraday charts yet. RSI14 on the daily charts rests at 44.08 and on the RSI21 the value sits at 48.76 both beneath 50 and therefore arguably in neutral to bearish territory. Daily RSI7 is 30.5 which has just managed to get out of an extremely oversold position taken during the post-peak flush-out.
The intraday move was quick and did really happen, but the daily chart has not yet formed an uptrend. It’s a bounce within the daily time frame that needs to be matched with the other on-chain metrics for a more precise positioning.
Key levels the chart is highlighting
The Fib swing up from $1.29 to $2.89 shows the 50 percent retracement level is $2.09 and Monday’s candle barely managed to fall beneath it as it trends at $2.013. The 38.2 percent retracement at $2.28 is the next logical resistance should the $2.09 level change from resistance to support, and $1.90 where the 61.8 percent level lies, represents the main daily support.
Today’s daily pivot from the session prior is at $1.77, which has been very near the opening and low for Monday’s session and served as a support for the upside push. As long as the price remains above the daily pivot on a close basis, the bounce has a base under it.
On the intraday Fibonacci (swing from $1.71 to $2.17), the 23.6 percent retracement at $2.06 and the day high $2.198 should create immediate overhead resistance. Above this zone, at $2.30, the 127.2 percent extension would be the first target to the upside if sellers fail to defend the $2.06 to $2.17 area on a retest.
The non-obvious read from the longer chart
Zooming out the daily chart, TON’s range was about $1.20-$1.65 in February-April before the mid-May surge to $2.89. That old range was the accumulation period (nearly 3 months long), which was the old base. Mid-May surge both breached and reset expectations in both directions; the markup was as brutal as the markdown.
The Monday candle actually opened just over the top of that old base at $1.765, held $1.75 for a low and claimed back over $2.00. Buyers retested the old range’s breakout levels. Whether that holds is another scenario, but the structure is much more promising than just the focus on the rise of 14 percent.