



Bitcoin has climbed back up to about $64,328 after suffering a dramatic decline from the mid $70s (around $74,000) to around $58,000 in June. So far, this recovery has been smooth, but this past trading week the price once again is testing the $64,300–$65,000 level. This resistance level has rejected buyers twice during the time of the past two weeks.
The 24-hour trading volume was $26.78 billion. Even though this amount may be sufficient to drive the recent momentum forward, it has not been enough to kick Bitcoin into a completely new trend. For nearly two weeks now, the price has been trading between the $62k and $65k ranges, indicating neither buyer nor seller has truly gained firm control over the trend.
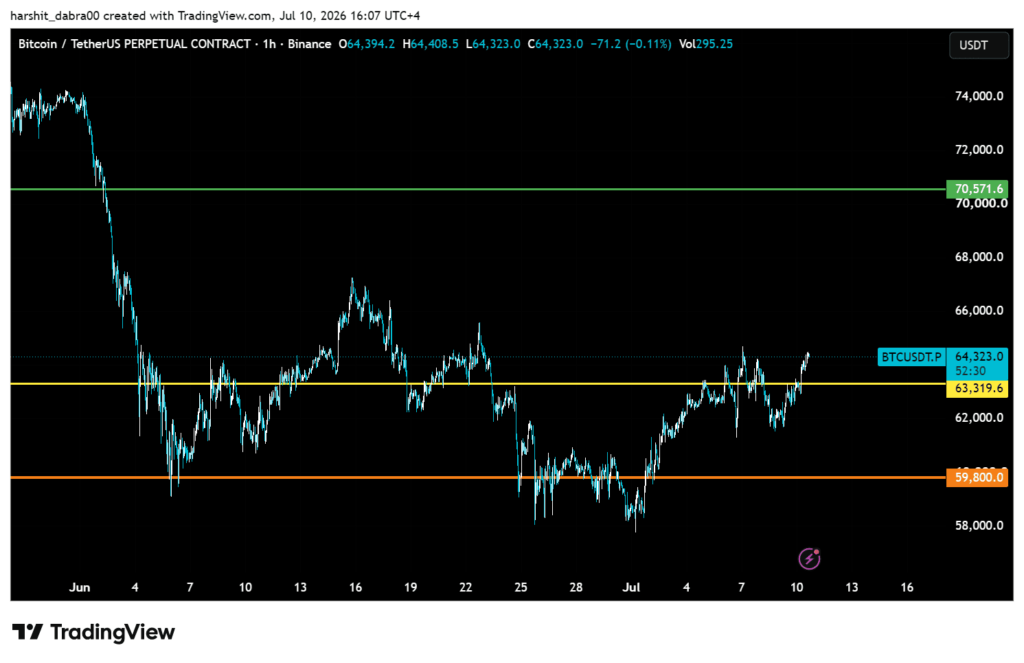
The technical setup does mirror this equilibrium. Bitcoin has reclaimed $63,319, which has served as support and resistance several times since late June. The first hurdle ahead lies at $65,000, with stronger resistance further ahead near $70,571. Below, $59,800 holds firm as the crucial support level after it successfully deflected the June selloff on two occasions.
The long-term outlook is the same: the BTC price remains below the longer-term moving averages (the 200-day SMA is $74,224 and the 200-day EMA is $75,961), which is why the trend remains unchanged. Shorter moving averages turned positive, indicating short-term bullish pressure is dominant.
ETF flows are slowing down
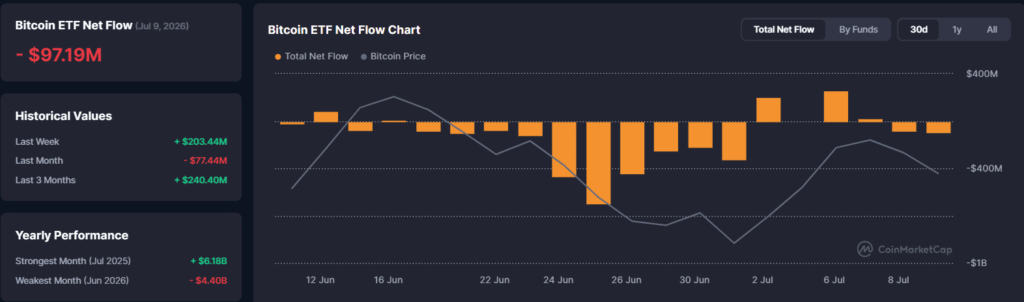
This decline from $58,000 coincided with the July outflow, which largely corresponded with Bitcoin’s drop to $58,000 in late June. The ETF saw fresh inflows between July 6th and 8th, which helped push prices back up to above $62,000. This inflow on july 6 alone was $209.4 million on July 6th by IBIT.
This ended yesterday, as ETFs saw $97.19 million in net outflow. FBTC witnessed the biggest outflow by far, with $63.3 million leaving the fund. Nonetheless, weekly flows remain at a healthy $203.44 million, so this is unlikely a serious turnaround but indicates buying demand has dried up at the exact moment Bitcoin’s approaching resistance.
Grayscale’s GBTC remains the poorest-performing fund among all the spot Bitcoin ETFs, with over $27.43 billion in total net outflows since launch. That compares to BlackRock’s IBIT, which has gathered nearly $59.7 billion. It may be a difference that influences the direction of the ETF market, although almost every other spot Bitcoin fund is in positive net inflow terms.
The resistance that still matters the most for the price action
The side of technical indicators is also improving as the selling pressure goes for a cooldown. The MACD histogram is on the positive side, with the MACD line moving close towards a bullish crossover. At the same time, RSI7 stands at 57.41 and RSI21 at 46.45 and can be classified in the healthy territory. This scenario is suggesting that without turning overbought, the momentum is building up.
From the Fibonacci perspective, this largest cryptocurrency has reclaimed the 50 percent and 61.8 percent retracement levels and that makes $65,006 the next resistance. In the best case, a break above this respective level could push the asset to $69,832, making $70,571 as the next target.
The importance of a fresh demand for Bulls
The recent rebound of the asset has forced the short sellers to close their losing positions and that in result gave more liquidity for Bitcoin to go higher. The thing to note is that the short covering by itself is not likely to keep the continuation of the rally.
If ETF outflows continue, the market bulls may struggle to push through the price level of $65,000. Traders who scaled in the positions during the recent ETF inflow period are now dependent on fresh demand to keep the picture of recovery intact. Without it, Bitcoin would probably remain trapped inside its current range rather than have the possibility of starting a sustainable breakout.


