SUI is very bearish on the short-time frame chart, as it barely has the strength to hang below the psychological $1 level. However, the token is very bullish on the weekly chart.
Priced at $0.9, SUI has been making lower lows and lower highs as it forms the bearish flag. Unlike a conventional bearish flag, which forms higher highs and higher lows before breaking downwards, the SUI bear flag is different.
Sellers dominate the daily SUI chart
A normal bearish flag is a continuation pattern that forms after a sharp downward move, where price temporarily consolidates in a small upward-sloping or sideways channel before continuing lower.
In such formations, the consolidation process is expected to result in only a minor rebound, where the highs and lows are higher, or even just an upward drift. This indicates that the selling process is temporarily on hold without actually reversing its overall trend. Eventually, however, sellers take charge, and the price moves downward along the established trend.
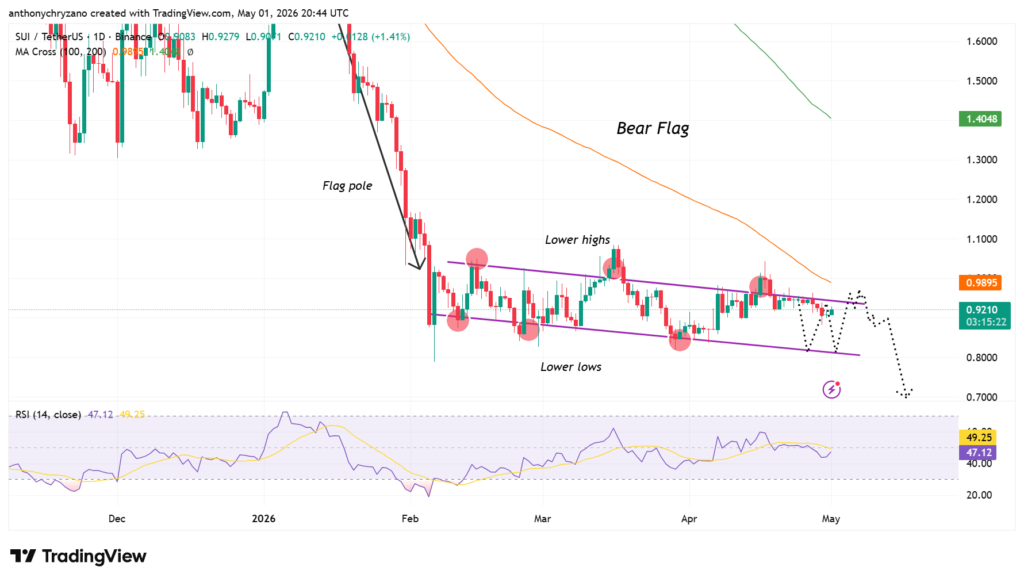
On the other hand, the bearish flag formation pattern in Sui is different from the bearish flag formation in that instead of creating a consolidation pattern, which can be considered relatively mild and upwards, it still forms lower lows and lower highs despite being part of the flag pattern.
This means that sellers were dominant during the consolidation period, while buyers could not create a counter-reaction. This pattern shows that the flag pattern is more of an extension of a downtrend than a temporary corrective pattern.
This typically happens when bearish momentum is extremely powerful, market sentiments are poor, or there is inadequate liquidity on the buyer’s side, such that all rallies created are immediately sold out.
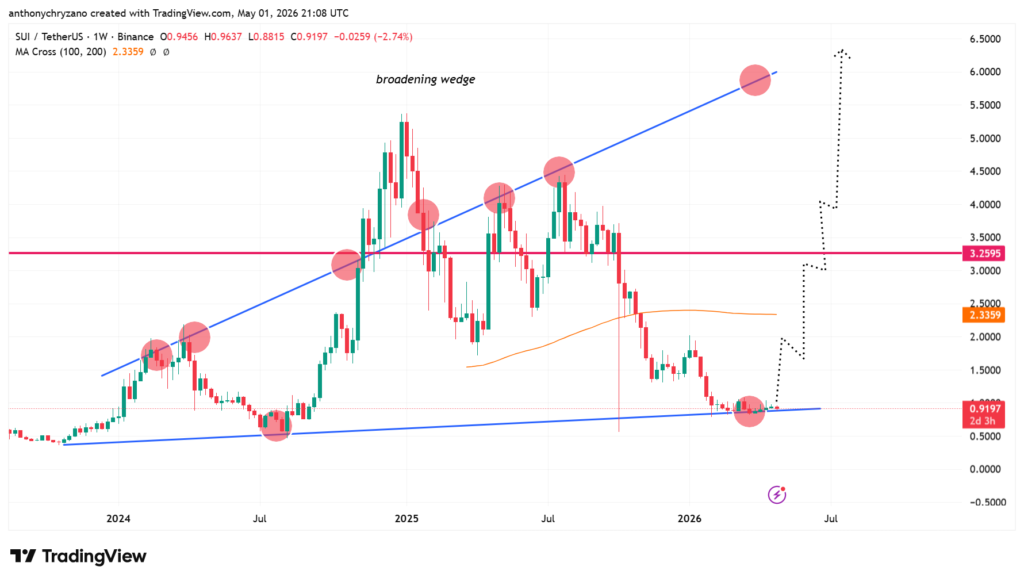
However, when zooming out and looking at the macro trend since 2024, it doesnt look bearish at all as it is on the daily chart.
A broadening wedge (or expanding triangle) is a pattern where price becomes more volatile over time instead of tightening. It forms when the market starts printing higher highs and lower lows, with each swing getting larger than the previous one. This creates a widening structure where the two trendlines spread apart, showing that volatility is increasing and there is no clear direction.
It develops after the market begins marking higher highs and lower lows, but each swing is much bigger compared to the previous one. Thus, it is forming a spreading pattern where the two trendlines move away from each other, indicating growing volatility and absence of directionality.
Buyers drive up prices while sellers short rebounds
The internal dynamics within such a structure is dominated by confrontation between buyers and sellers. Buyers continuously try to drive price up to new highs, while sellers constantly short every rebound, forcing price to reach new lows. Nevertheless, none of the two sides manages to stay dominant for a long time due to constant switching.
Such behavior leaves many traders trapped, as volatility continues to grow, and stop losses are regularly executed on the upper or lower end of the range. This type of structure usually appears during volatile environments with unclear directionality or high emotions/uncertainty.
In addition, it can be formed during accumulation or distribution cycles of larger players with rising volatility that helps to scalp liquidity on both ends of the range.
Now that the price of SUI is at the lower trendline, it should naturally rebound from this level and move toward the upper trendline, which is near $6. However, an analyst who goes by the pseudonym Crypto Patel mentioned that there could be a massive 25x increment in prices, and targets to watch for are $1.80 / $4.00 / $10 / $20.