Solana is trading at $88.36, up 3.14 percent over the past 24 hours, and 5.34 percent over the last 7 days. If we consider it on the base level, this price action appears as continued recovery momentum. However, in a bigger-picture structure, it can be observed that things appear to be moving rather sideways. The asset is not in a recognizable downturn stage anymore, but it hardly is in a recovery stage either. The asset price is currently squeezing within the structure of a long-term macro downtrend.
The longer-term scale is still prominent in the structure. Solana has seen a drop of 1.90 percent in 90 days and lost 38.35 percent from last year. These numbers give the market participants an idea that what is going on is taking place within a corrective structure rather than within a new expansion.
Price behavior reflects equilibrium rather than direction
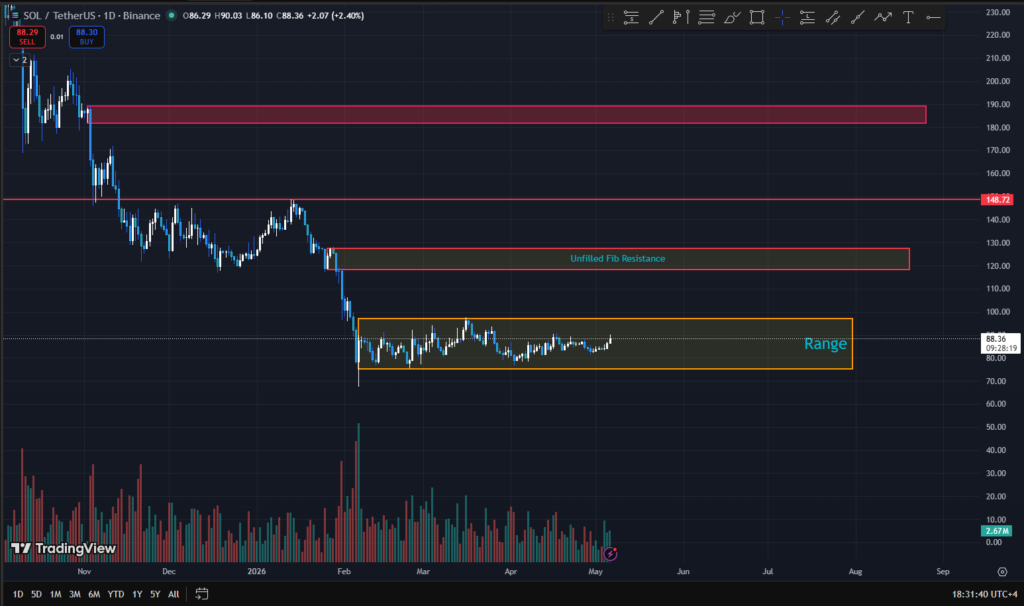
The current price action remains within a clear ranging structure, more or less in between the low $80s and around $94. The context for this range does not stem from random consolidation but is instead a reaction area where the price sold off aggressively earlier in the cycle. How price is behaving inside of the range, implying equilibrium formation between sellers and buyers and does not represent directional conviction as of now.
What’s most remarkable about this scenario is that price is not able to gain any lasting traction above the $90 area but is constantly finding buy orders in the mid $80s. What the market participants are essentially seeing here is a rotational profile that is absorbing liquidity in both directions with no apparent resolution and a set of characteristics that we often see as price shifts from an impulse to a balance phase.
Moving averages confirm split between short-term recovery and macro weakness
The structure of moving averages also supports this type of split. The 7-day SMA is currently mentioning $84.05, and the 30-day SMA is at $84.90, above the current price of Solana. It appears short-term pressure has now taken off, and the market may experience stabilization after initial bearish sentiment.
However, the macro structure still exhibits the same characteristics. The 200-day SMA ($116.29) is far distant from the price now, while the 200-day EMA is at $111.08. This difference plays a crucial role in determining the difference between the retracement attempt and the trend-reversing point; it’s still under corrective structure as long as the price can reclaim this region.
Momentum indicators show stabilization without expansion
The momentum readings are also supporting this. Considering the RSI, the RSI 7 is at 63.61, which should signify short-term buying pressure, but the RSI 14 is at 54.32 and the RSI 21 is at 51.45. They are sitting very close to the neutral territory and indicate that the recent up move is more of a confined move.
The MACD also displays this lack of direction. MACD is at -0.17552, just under the signal line at -0.16945. The histogram is relatively flat at -0.00606. This does not turn out to be an area of growing momentum but an area of transit, lacking directional power.
The Fibonacci structure defines compression zone clearly
The Fibonacci retracement range from 78.43 to 90.67 emphasizes precisely where the compression is. The price is trading at slightly above the 23.6 percent retracement at 87.78 and is just off the top of the range in play.
However, below this point there are a lot of supportive structures combining. This group includes the 38.2 percent Fibonacci retracement at $85.99, the 50 percent Fib retracement at $84.55 and the 61.8 percent Fib retracement at $83.11, a thick cluster of support. When combined with pivot points and moving averages, the result creates a dense cluster of liquidity from $83 to $88.
The current price of SOL appears to be in an equilibrium band and also reflects the concentration of both supply and demand. This type of pattern usually hinders the price trend.
The resistance structure remains heavy above current levels
However, support is also tiered and not just one level. At the top of the pile is the swing high that occurred at $90.67. Under that there’s a swing high and Fibonacci extension level at $94.00 and then at $98.23. Following that there’s a Fibonacci extension level at $102.91.
On the other hand, the level of greater structural significance is still at $116.29, which correlates with the 200-day moving average. This area is the macro trend boundary. Any upward movement, before testing, reclaiming, and being supported by decent volume, constitutes a correction.
Above this area there are more supply areas at $120, $148.72, and $190, but these are long-term structural levels. These would play into a reversal of macro trends.
Solana’s competitive positioning vs Ethereum
Apart from this short-term pressure to compress prices, Solana’s structural underpinnings are also driven by its competition against Ethereum, instead of solely by market cycles. The key advantages of Solana are higher throughput and cheaper fees, allowing it to be capable of processing much larger numbers of transactions per second compared to the capacity of Ethereum’s restricted base layer, which continues to be reliant on layer 2s. That has allowed it to become popular for fast-paced activity, such as launching memecoins, with a number of pump-fueled ecosystems speeding up this process as well as diversifying into stablecoin adoption, with USDPT issuance among institutional experiments.
Meanwhile, Solana’s narrative has strengthened its claims from its bounce back from the 2022 crash/FTX collapse to multiple cycle highs, whereas Ethereum is just steady on smaller cycle gains (while maintaining a higher developer and application floor). Instead of Solana ‘taking over Ethereum,’ it is consistently chipping away at the higher-velocity activities that it thrives in, while Ethereum holds its own in deeper infrastructure and density.