



Solana was once again rejected at the psychological $100 resistance level despite the network ending last week in a commanding position. The Solana network finished last week as the leading blockchain by average daily TPS, reaching over 1,216 transactions per second. Although the daily chart is bearish, the weekly chart shows SOL is sitting on a launchpad-like support level.
At a time when numerous ecosystems and platforms are showing substantial progress with regard to making improvements in terms of scalability, speed, security, and cross-chain connectivity, among others, Solana seems to have made some remarkable progress as well. Using a proof-of-history consensus algorithm, the blockchain achieved transaction speeds of over 1,200 transactions per second last week.
For Solana to achieve a throughput of 1,200+ TPS, it would mean that there is an increase in transactions on the network. For the network, this could mean that there is increased activity on the blockchain.
Increased TPS could mean that more users are transacting on DEXs, sending payments, minting tokens, etc., on the blockchain without causing congestion.
It can also strengthen the narrative around Solana’s scalability, since one of its main value propositions has been its ability to handle high throughput with relatively low transaction costs.
Solana’s TPS alone does not help the prices
However, TPS alone does not necessarily indicate a price shift. In that regard, more thorough analysis of the reasons for the move would be required. For instance, if there is growth in TPS because of the growth of usage, activity in the DeFi area, transaction fees, wallet transactions, and general growth of the ecosystem, it may be considered a solid positive sign for the asset since higher utility means higher confidence of investors.
For instance, if the TPS surge is driven by short-lived speculative activity, bot traffic, or temporary meme coin trading spikes, the price reaction may be limited or temporary. Markets often price in expectations before the data becomes public. This means SOL can sometimes rise ahead of strong network metrics and then show little reaction once the milestone is reached.
Solana spot ETFs inflow drops drastically
On the other hand, Solana’s spot ETF net inflows have plummeted dramatically from greater than $250K to almost $50K, implying that the speed of new money going into Solana investments may slow down.
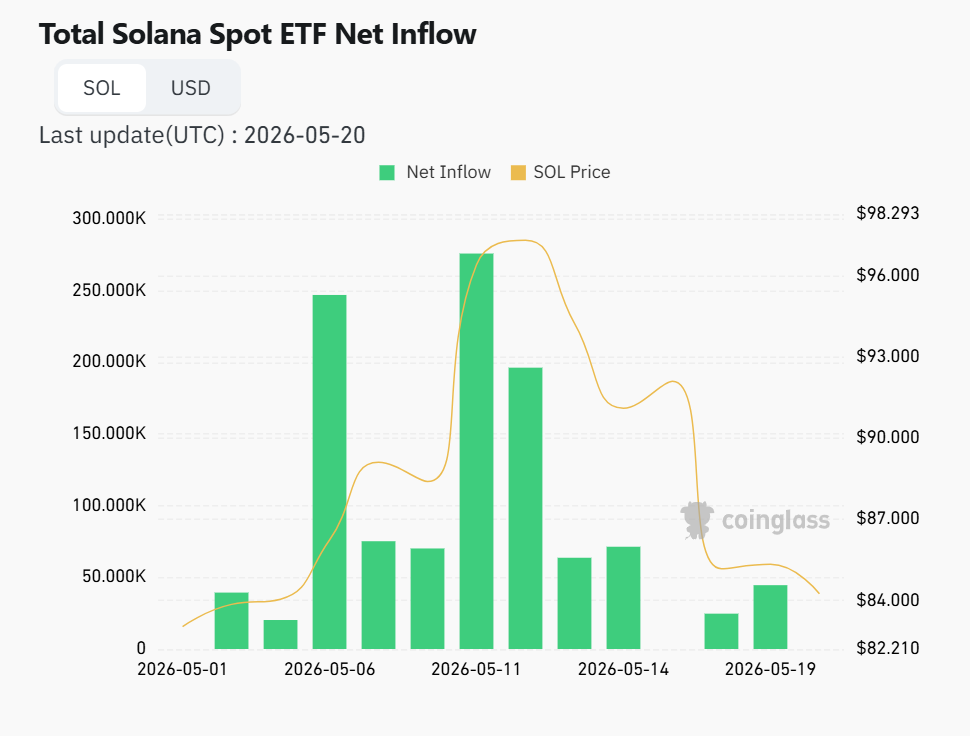
It is likely due to the more cautious attitude of institutional investors, because lower ETF inflows usually mean poor short-term interest or a lack of momentum in market participation. It might lead to the absence of demand in the Solana crypto asset. Nevertheless, it doesn’t imply a negative forecast about Solana’s future performance, because investors may wait for market triggers.
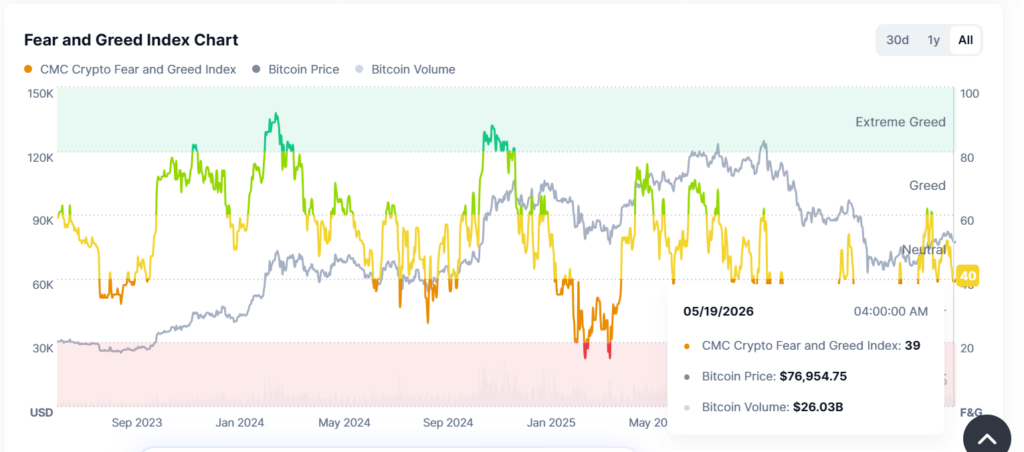
SOL price faces double rejection at $100 in 5 months
Despite the increasing transaction speed, Solana has once again been rejected at the psychological resistance level of $100. This is the second time for 2026 that SOL has been rejected at this level.
When the whole scenario of how the prices behaved since the beginning of this year until now is put into context, SOL is trading inside an ascending broadening wedge. An ascending broadening wedge is a bearish breakout pattern where the price makes higher highs and higher lows, but the distance between those highs and lows keeps expanding over time. This creates diverging trend lines that move upward.
Inside the pattern, market behavior usually becomes increasingly volatile. Buyers continue pushing the price to new highs, showing that bullish sentiment still exists. However, sellers also become more aggressive at each higher level, causing larger pullbacks after every rally. Instead of price movement becoming tighter and more controlled, the swings become wider, reflecting growing uncertainty between buyers and sellers.
Solana rests near March 2022 levels
Although the daily chart above shows bearish price action, the weekly chart below shows SOL is at a critical point or a support level, which could skyrocket the prices.
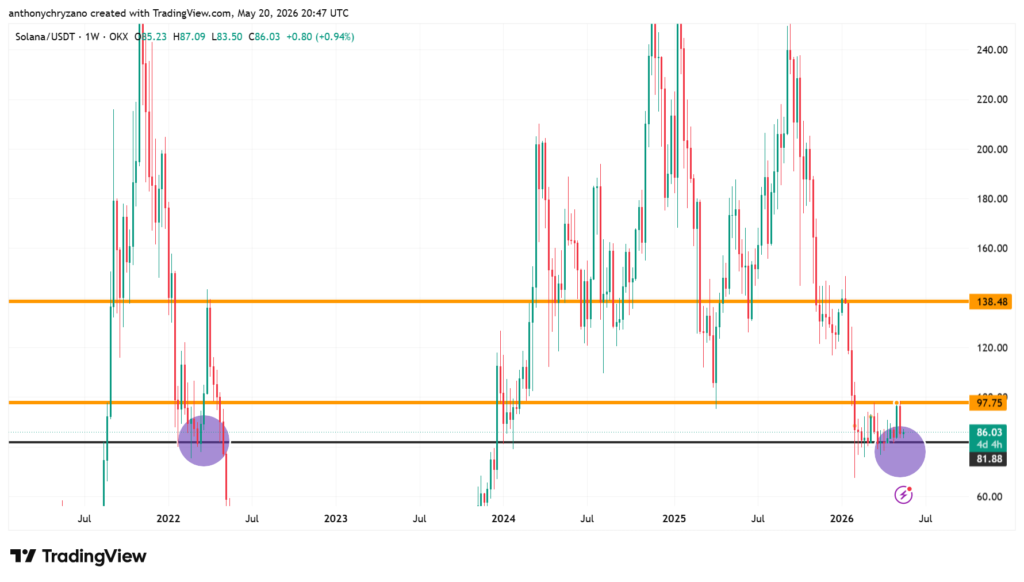
Stationed at the March 2022 price level, SOL is now resting on a launchpad that catapulted the prices to over $135 four years ago. When investors and traders see the broader context of Solana and its historical behavior, they will make this point and entry. And as more participants enter the market as this level becomes a point of control, with the increase in demand, SOL prices could shoot up.


