

Solana (SOL), the 7th-largest cryptocurrency by market cap with a valuation of more than $44.1 billion has cleared a stiff technical hurdle on the 12-hour chart. The digital asset looks ready for a breakout, potentially rising as high as $85 in the coming days.
Solana breaks out of the falling wedge
In an X post on Thursday, crypto analyst BATMAN said that SOL has broken out of a falling wedge pattern on the 12-hour chart, teasing a quick rise to the mid-$80 price level. The analyst shared the following chart to explain the bullish momentum reversal.
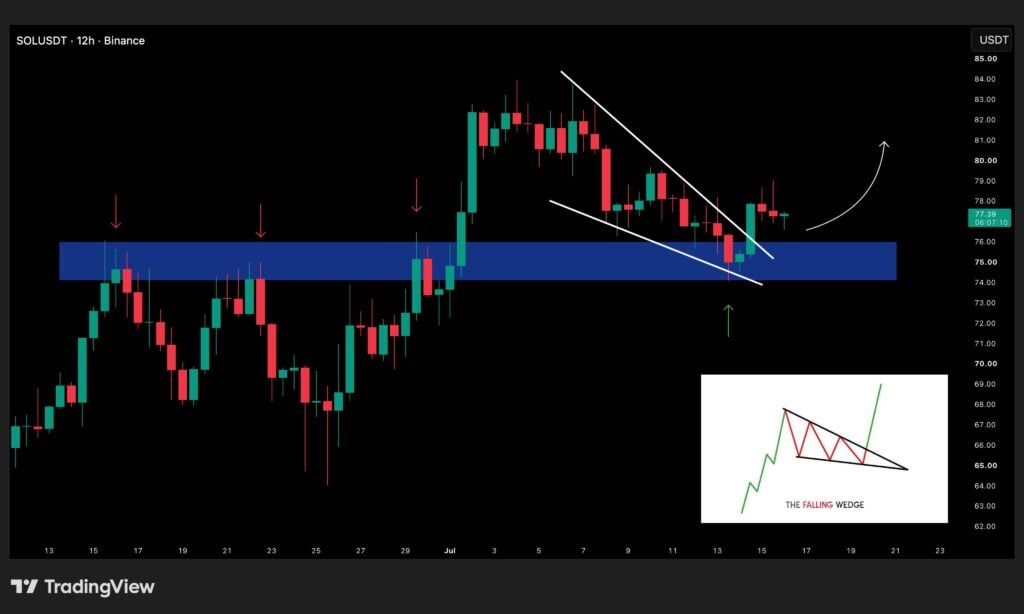
A falling wedge is a bullish chart pattern that forms when price makes lower highs and lower lows within two converging downward-sloping trendlines, indicating that selling pressure is gradually weakening. The pattern is confirmed when price breaks above the upper trendline, showing the start of an upward trend.
The analyst remarked that SOL looks “very solid” at its current price. Similarly, fellow crypto analyst Seth shared his own SOL bull thesis.
The analyst highlighted that SOL is following the Wyckoff accumulation pattern. Seth shared the following SOL 8-hour chart, suggesting that the cryptocurrency is currently in Phase D of the pattern, chasing the resistance lines before it springs into Phase E.
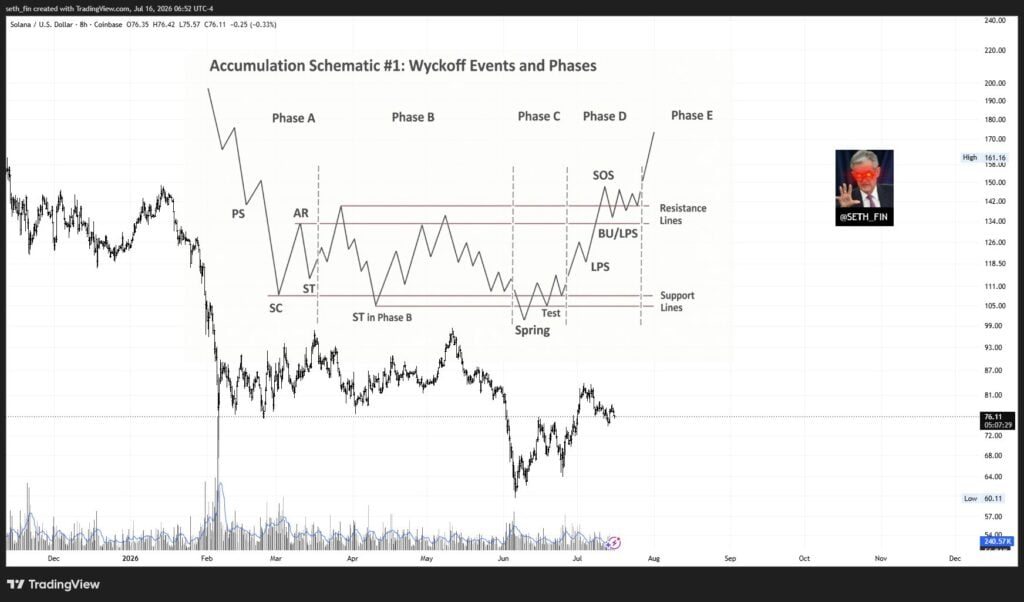
For the uninitiated, the Wyckoff accumulation pattern is a market structure that describes a period where large investors gradually accumulate an asset after a prolonged downtrend while price trades within a defined range. A breakout above the range typically signals that accumulation may be complete and that a new uptrend could be beginning.
Warning signs still linger
Despite the excess of optimistic chart patterns, some analysts are still not fully sold on the idea of SOL reversing its course immediately. In fact, crypto analyst Killa went on to say that SOL may actually never really reach its all-time high.
According to data from Coingecko, SOL’s ATH of $293 was recorded in January 2025. Since then, the digital asset has slumped 74.2 percent, currently trading around $75. However, on June 25, SOL showed signs of MACD divergence, signalling weakness.
Similarly, on June 23, the cryptocurrency formed a bearish double top pattern, threatening a sharp pullback to the $50 area.