

Bitcoin’s realized cap variance (RCV) – an on-chain metric that measures how far BTC’s current market value has diverged from investors’ aggregate cost basis – on Thursday, entered a zone that it has been in for less than 1 in every 16 trading days across 16 years of on-chain history.
Bitcoin realized cap hits lowest since 2018
As of Thursday, the standardized RCV reading is hovering around -2.35, approximately the bottom 6 percent of the dataset back to 2009. The market has entered a so-called “deep value” zone for 20 consecutive days.
Today, the signal has flashed its strongest signal – 3 times the max conviction level – increasing 2 times in the past week – on July 2 and July 9. To know why this metric matters, it is first imperative to understand what exactly it measures.
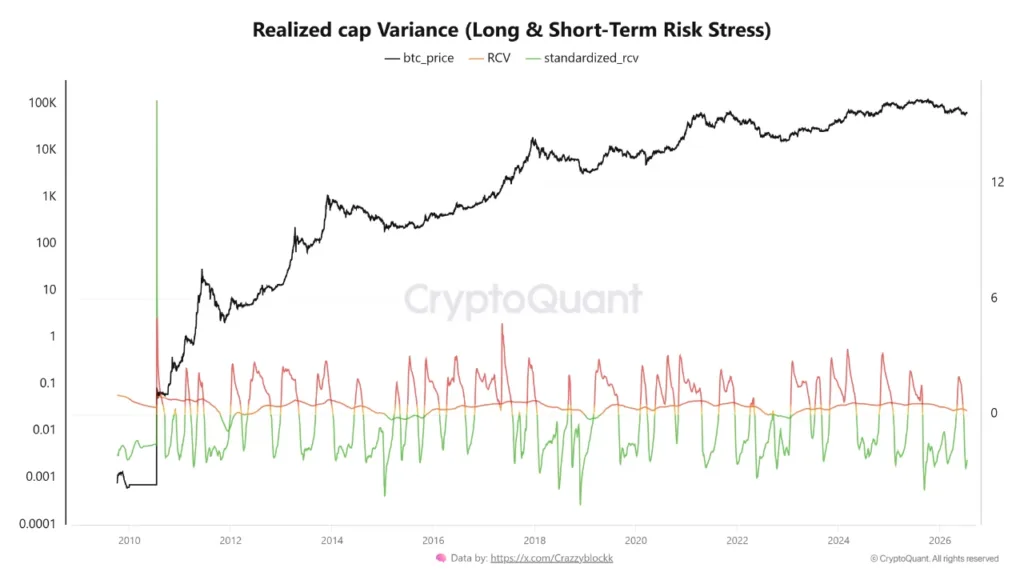
Instead of tracking price alone, it isolates the variance between realized cap and market cap relative to its own rolling history, capturing how stretched or compressed investor cost basis has become versus current valuation.
When the RCV goes deep into negative z-score area, it means that the emotional premium developed during rallies has already been priced out. Essentially, instead of reading the narrative, the metric reads the distribution of capital.
At present, BTC is trading slightly above $64,000, still down significantly from its October 2025 all-time high of $124,700. Every prior instance where the model spent so much time below a -2.0 z-score – such as late 2018, mid-2022, early 2015 – was followed by 12-month returns as high as 75 percent.
In November 2018, the metric reached its most extreme value of -4.68, which coincided exactly with the BTC bottom of around $3,792. While the metric isn’t a bottom predictor, it shows that current positioning statistically resembles capitulation far more than a mid-cycle correction.
Is BTC paving the way for altcoin season?
Over the past few months, BTC has flashed multiple bottom signals, raising the bulls’ optimism that the worst may already be over for the top cryptocurrency. On June 15, BTC flashed a bullish MACD cross indicating that selling pressure is slowly pulling back.
BTC’s price movement around the $64,000 area as altcoins continue to wait for a breakout signal. On the other hand, CryptoQuant CEO said the current BTC rally lacks the signals required for a meaningful bullish trend reversal.