The 30-day moving average of the altcoin trading volume of centralized exchanges has broken over the 365-day moving average. On CryptoQuant’s CEX Volume Ratio, altcoins (all assets outside of BTC, ETH, SOL, XRP, and BNB) are against the top 5, indicating the “Altcoin Volume Increasing Trend.” It will be active again in 2026.
What the ratio actually measures
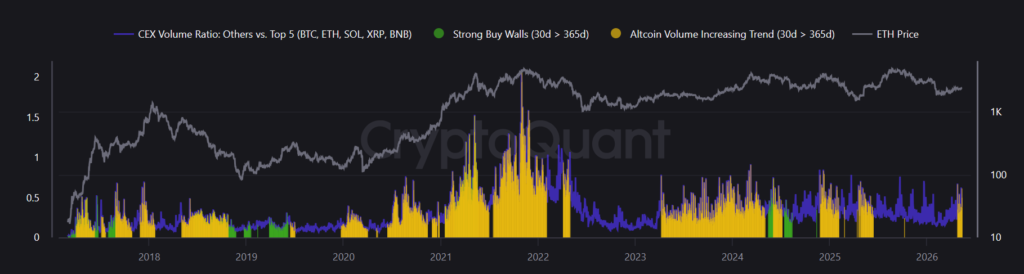
The CEX Volume Ratio (Others vs. Top 5) is not an index of whether altcoins are more actively traded. It is about how large the proportion of altcoin trading volume is in relation to the five largest assets by market cap/liquidity. An increase in the 30 day average above the 365 day mean indicates that shorter-term altcoin activity is decidedly more intense than the average of 365 days prior and that a sustained directional increase has been noted for exchange volume concentration.
The purple line on the chart actually shows the ratio. When the purple line is ascending, it signifies that capital is shifting out of blue chip crypto and into more altcoins, and attention is doing the same. When the purple line is flat, or descending, even during yellow bar occurrences, the surge in volume within altcoins has not reached a significant enough proportion to alter the structural ratio.
The 2021 reference point and why it is not a clean analogy
The most obvious precedent can be seen during the 2021 bull run. During the time frame between the beginning of 2021 until the middle of 2022, the chart was fully dominated by the yellow bars. The ratio gained a significant increase at points, reaching over 2.0 which represents that altcoin volume was 2x that of the top 5. The price of ETH shown on the right axis during this time period rose from below $1000 at the beginning of 2021 to over $2000 during the time frame that the ratio was climbing. The relationship of constant yellow bars and increasing ratio can be clearly seen, while the price of ETH has correlated with these during this time frame.
There are two more signals plotted together with yellow bars: a green signal, “Strong Buy Walls (30d greater than 365d)”; This signal is infrequent; looking at the entire historical range, from 2017-2026, green signals occur for short bursts, specifically around 2018-2019, 2020, and the beginning of 2026. Its occurring together with the yellow trend signal has been historically infrequent and it has appeared preceding short bursts in volume expansion on some occasions.
The current chart indicates that yellow bars will re-emerge in 2026 along with a green marker on what appears to be one of them. However, the ratio (purple line) has not yet established a clean breakout and stays low compared to the 2021 high as well as compared to the ratio increases in 2023–2024.
The non-obvious read
A more accurate reading of the situation is that the volume trend signal is necessary but not sufficient. Yellow bars showed up multiple times through many months of 2023. Ratio spiked higher occasionally but only to below 0.5 and remained there. Price for ETH generally stayed flat or slightly positive during these months. Capital flowed into altcoins on an episodic basis but there was no across-the-board altcoin rally. Traders who read every yellow bar as an all-purpose entry signal in 2023 found some assets performed strongly while the rest did not.
The difference in the structure in 2021 was not just the presence of yellow bars but rather a combination of a rising ratio, a steady flow of volume (not weekly spikes) and an ETH price, which itself was rising instead of coiling. The three things were in confluence. Currently the ETH price is at $2,339 two of the three legs are already confirmed; the outstanding one is the ratio currently trading at 0.3825. This has remained flat and hasn’t as yet started trending, the condition needed to indicate rotation.
The green buy wall signal supports this period not just being noise. But looking at what the chart indicates, there has been no structural shift confirming this trend of volume in the ratio.
What it means for the market participants
The ratio line (purple) is the confirmation signal. If the ratio line starts to move upward from its current compressed range and towards 0.5 and higher, this would represent that the volume of altcoins isn’t just pushing above its yearly average; it’s actually changing the structural balance of CEX activity, and that’s generally been the area that’s performed best for broad altcoin exposure.
The price of ETH is the macro backdrop to all this. As it stands at $2,339, it has already moved above the level where we typically see altcoin rallies extend the furthest. So one of the conditions is now met and off the watch list. All we need is the ratio to start moving away from 0.3825 towards 0.5, and so on for the setup to be technically similar to that in 2021.
This is the point that gives asymmetric upside to the read, as the green buy wall signal is being used with the existing yellow trend and both signals happen rarely enough on the entire 2017-2026 data set that they should be paid some attention rather than ignored.
Right now the signal is indicating that the rotation into altcoins on a more comprehensive scale is building. While conditions to deliver on that rotation have not shown itself yet within the ratio, confirmation that they are producing should be apparent.