


Mantle (MNT) has once again failed to clear the downtrend line that has been lasting for the past 5 months. Although Mantle price looks like it is continuing the downtrend that began during the beginning of 2026, when price action of MNT is observed closely, it is recovering.
Mantle bulls defend the 50-day MA support
Priced at $0.66, Mantle has lost about 5% of its value during the past 24 hours. Despite losing 5%, the token is still able to hold its shape above the 50-day moving average. MNT prices moved above this psychological resistance level after nearly a month. When a token remains above the 50-day moving average despite a price drop, it generally shows that the broader trend is still relatively strong and that buyers are continuing to defend key support levels.
Traders widely watch the 50-day moving average because it acts as a medium-term trend indicator. As long as the price stays above it, the market is often viewed as structurally bullish or at least stable.
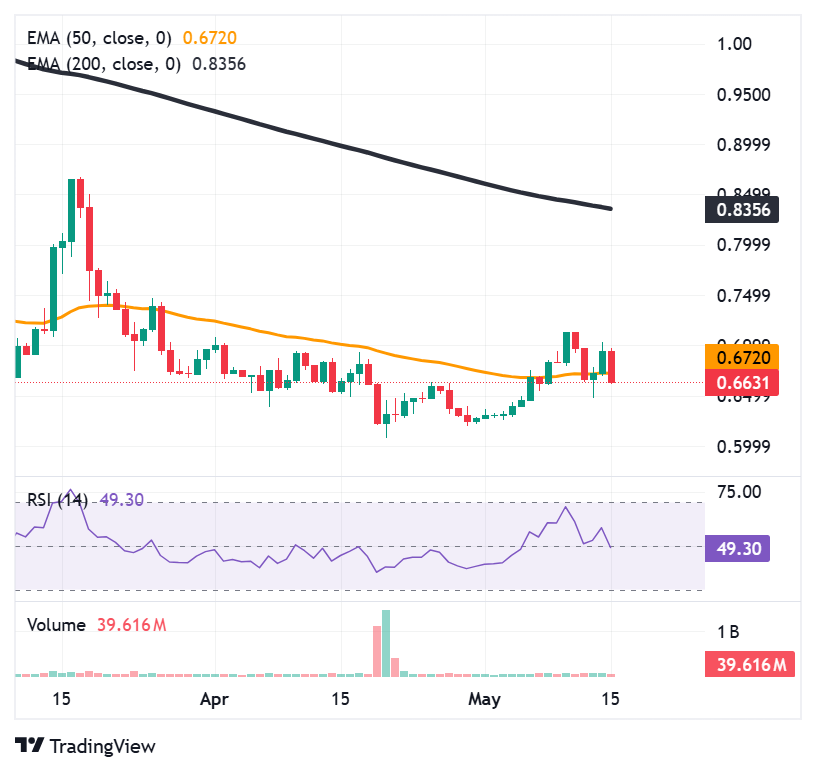
In this scenario, although the token had declined by 5%, since it managed to “hold its shape” above the moving average, this implies that the current sell-off has not yet done harm to the overall market structure. In other words, contrary to expectations of falling prices below support, the price is absorbing the selling pressure without compromising its place on the trend.
From a psychological point of view, such a pattern often points to high confidence on the part of the investors. The latter, in their turn, are likely to defend the asset from its key support level. If the token continues holding above the 50-day moving average, traders may interpret the decline as a temporary pullback rather than the beginning of a larger reversal.
Although MNT might have held its shape above the 50-day MA, it is still unable to break above the downtrend line that has kept it restricted for almost 5 months now. This is the third time in five months that the token has been testing this descending trendline and has been rejected.
Mantle continues to trade below the 50-day MA for fifth month

The repeated rejection from the downtrend line suggests that every rally attempt is being met with selling pressure before the token can establish a true breakout. Since this is already the third rejection in five months, the trendline is becoming a psychologically important resistance zone that traders are watching closely.
From a technical perspective, this reflects a market stuck between support and resistance. Buyers are strong enough to prevent a major breakdown below the 50-day moving average, but not strong enough to overcome the broader bearish structure. This creates a compression phase where momentum is weakening and price remains trapped inside a longer-term downtrend.
Trader behavior inside this setup is also important. Many short-term traders may continue taking profits or opening short positions near the descending trendline because previous rejection points have proven reliable. At the same time, bullish traders may hesitate to enter aggressively until the token finally closes above that resistance with strong volume confirmation.
It is easy to overlook the price of MNT and say that it is still being dominated by the bears. However, when the price action is closely observed, there is much more data that could be retrieved. As shown in the chart below, MNT is making the cup and handle pattern.
Bull are actively working undercover
A cup and handle is a bullish chart pattern that typically signals a continuation of an upward trend after a period of consolidation. The pattern gets its name because it visually resembles a teacup, with a rounded bottom followed by a smaller pullback that forms the “handle.”

The first part of the pattern, known as the cup, forms after a price decline and gradual recovery. Instead of a sharp V-shaped rebound, the price usually moves in a rounded structure, showing that selling pressure is slowly fading while buyers steadily regain control. This rounded bottom is important because it reflects a healthier transition from bearish sentiment to accumulation.
The closer the price reaches the old resistance point, the more likely it is that the buyers from the previous high would start to take profits. This results in a retracement phase, which acts as the handle for the pattern. The handle typically does not cover much distance compared to the cup part.
Within the formation pattern, there is an evolutionary change in the market psyche. In the left side of the cup, fear and selling rule the markets. When we reach the lowest point of the cup, the strength of selling subsides, and buyers start accumulating positions on the sly. When the right side is formed, there is a gradual restoration of confidence. The handle comes into play as a last chance for a shakeout process. Once we start going up in the pattern, MNT will move up.


