The Injective (INJ) token is nearing its lowest point and is reversing after the project introduced the community buyback mechanism in late 2025. The token is currently approaching a psychological resistance level of $5.
INJ community buyback gives life to the token price
The INJ Community BuyBack scheme is a monthly on-chain system that operates within the Injective protocol environment in which users stake their INJ tokens in a set period. The tokens are burned collectively in a systematic fashion. The token becomes irreversibly burned once staked, which results in a reduction of circulating supply. Participants get rewarded with a share of the ecosystem earnings.
This mechanism efficiently merges the concept of token burning and yields, bringing the incentives of the users closer to those of the network itself. It was an evolution from the previous Burn Auction concept and represents a reward scheme that is now enjoyed by all network participants rather than just one lucky individual.
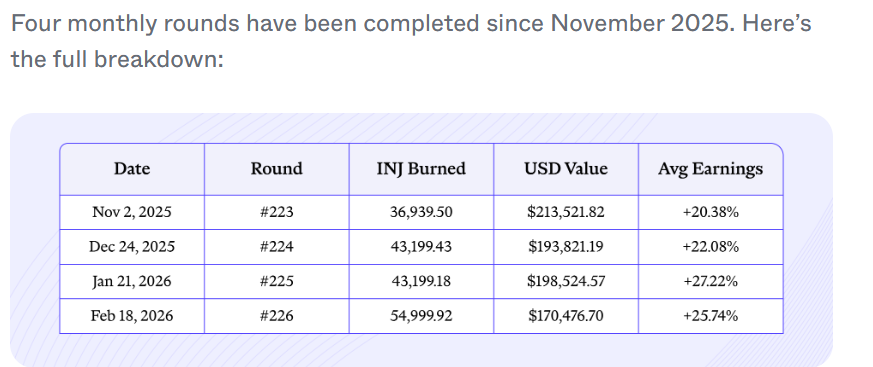
INJ buyback program saw 180,000 INJ burned
INJ Buyback program has seen an accumulation of 178,338.03 INJ burned through its four rounds of participation, which saw the distribution of a total of $776,344.28 worth of USD among the participants. Participants have made returns of approximately 23.9% each round. The participation is growing at a rapid rate, as shown in the number of INJ burned from Round #223 to Round #226, which grew from 36.9K INJ to 55K INJ respectively.
According to INJ’s official website, “Each round has been bigger than the last. Burns went from 36.9K INJ to nearly 55K, and participants haven’t earned below 20% in any round yet. The BuyBack pool grows as the Injective ecosystem revenue grows, so the trajectory should continue.”
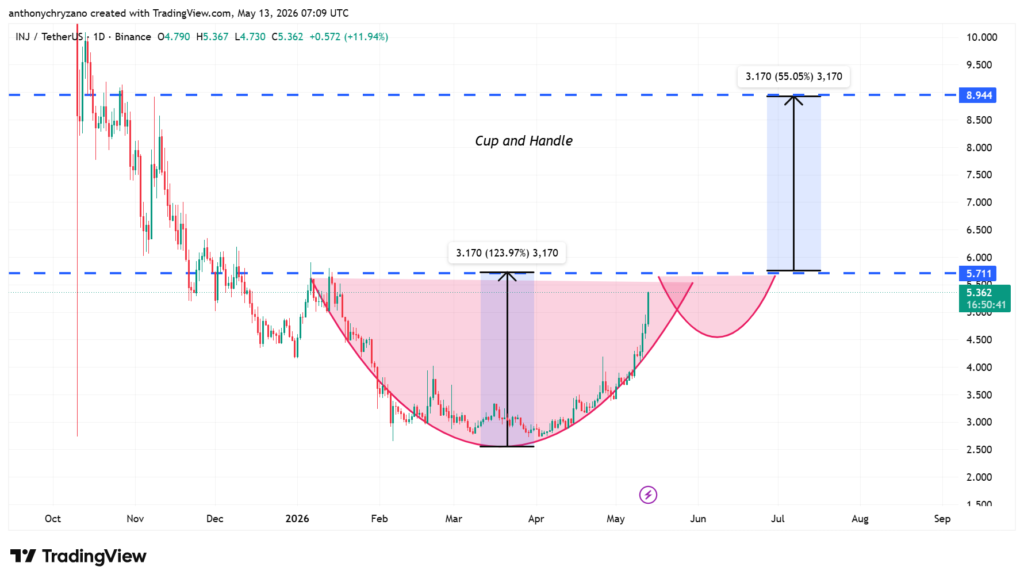
As far as the prices are concerned, INJ is reversing with a round bottom. This means that there is a high chance that this pattern could convert into a cup-and-handle pattern.
INJ forms the cup and handle pattern
The cup and handle pattern is a bullish chart pattern that looks like the silhouette of a teacup made up of a round-bottomed base with a retracement before a breakout. This pattern typically develops during a sharp drop in price action when fear and selling sentiment are the prevailing market forces. With the downtrend losing momentum, institutional and long-term buyers start purchasing the stock, which initiates a slow recovery.
During this phase, confidence slowly returns to the market as sellers become exhausted and prices stabilize.
As the asset reaches the point of its prior resistance, several previously trapped investors who were caught in the fall of the asset begin selling their assets to cover their losses, while speculators are taking their gains from the trade. This results in a smaller retracement move, which is referred to as “the handle.”
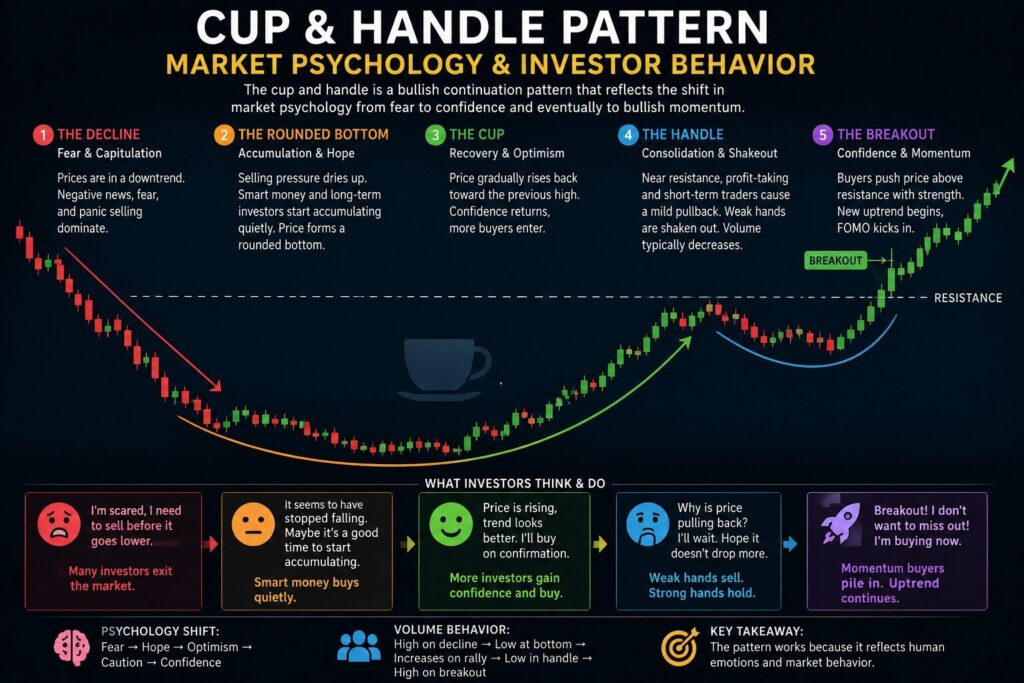
In case the buying momentum continues and prices manage to break above the level of resistance, then the reversal will be confirmed, with momentum and fear of missing out setting in, thus leading to a continued advance in the trend.
For the INJ, the round-bottoming base is yet to be completed, indicating that the market is in the accumulation mode and not in the breakout mode. This means that the selling pressure slowly subsides as the buyers and the “smart money” start taking positions.
The gradual and curved nature of the bottom signifies the psychological evolution in the market from fear to stability. In order to complete the cup and handle pattern, the token needs to recapture the upper resistance level after failing at it.
After the formation of the rounded base, the next step is usually the formation of the handle, which is a corrective retracement that happens at the level of resistance. The significance of this step lies in its ability to shake out the weak hands and give the shortsellers an opportunity to make profits before the uptrend resumes.
Volume usually contracts during the handle, signaling reduced selling pressure and preparation for a larger move.
The next step in the chart will be a breakout of the breakout stage if the buyers can manage to digest all the selling pressure left in the market. As per technical analysis principles, when there is a breakout in a pattern like cup and handle, the expected rally can be calculated using the depth of the cup.
What this implies is that after the breakout pattern is identified, there will be a possibility for a long-term upward movement driven by positive market sentiment, momentum trading, and Fear of Missing Out (FOMO).