



Hyperliquid (HYPE) is currently testing the last resistance level before hitting a new all-time high. Priced at $47, HYPE has one more resistance at $49 to break before heading towards a new all-time high of $60. But there will be an intense battle between the bulls and bears before HYPE reaches its new all time high.
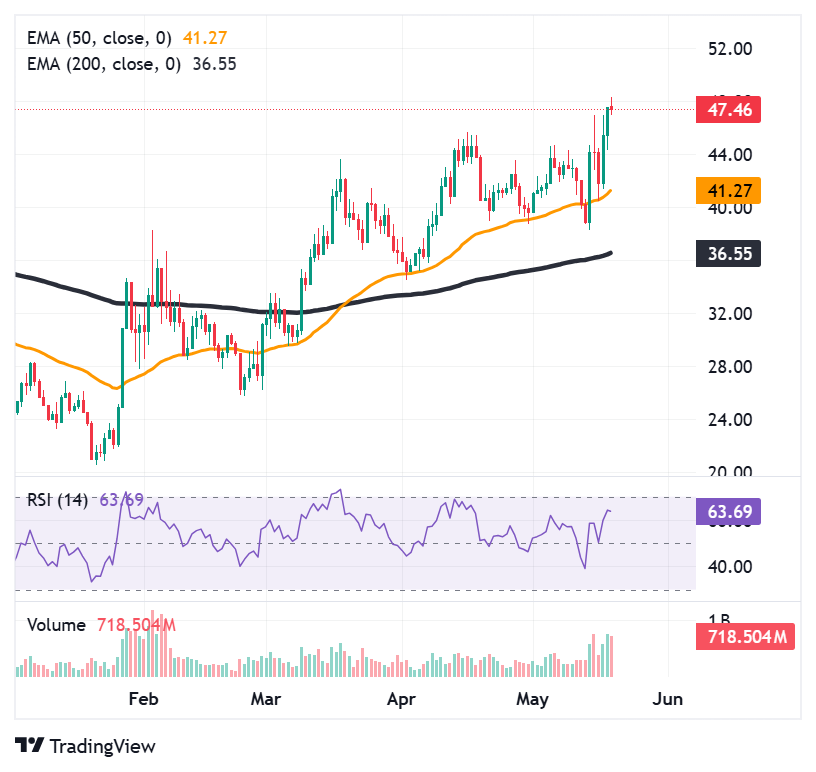
From March until now, the 50-day moving average has provided support for HYPE. The token has been making higher highs and higher lows. In cases where HYPE makes higher highs and higher lows while staying above the 50-day moving average, it means that the bulls still have a good grip on the market structure. This is because the higher highs indicate that buyers continue to bid the price above its past highs.
Higher lows are just as critical, as they suggest that when pullbacks occur, it is still the case that buyers enter sooner than letting the price retreat to its former lows. This combination of elements results in an upward stair-step formation that represents bullish strength.
HYPE uses the 50-day MA as support
The move taking place above the 50-day moving average increases the confidence in the move. The 50-day moving average is extensively used by traders as an intermediate-term indicator for identifying trends. More importantly, the moving average frequently forms dynamic support in uptrends.
When prices manage to remain above it, the 50-day moving average is interpreted as confirming the strength of the overall trend. Any pullback towards this average usually turns out to be a buying opportunity.
.
As far as trader behavior is concerned, bullish traders and swing traders are usually more comfortable trading such a setup due to the fact that the trend remains validated by the market.
Buyers fancy entering at pullbacks
The buyers are likely to buy on pullbacks to accumulate positions, whereas the momentum traders would join on breakouts to new highs. However, the shorts usually exercise more caution since shorting a market with higher highs and higher lows can turn out to be dangerous.
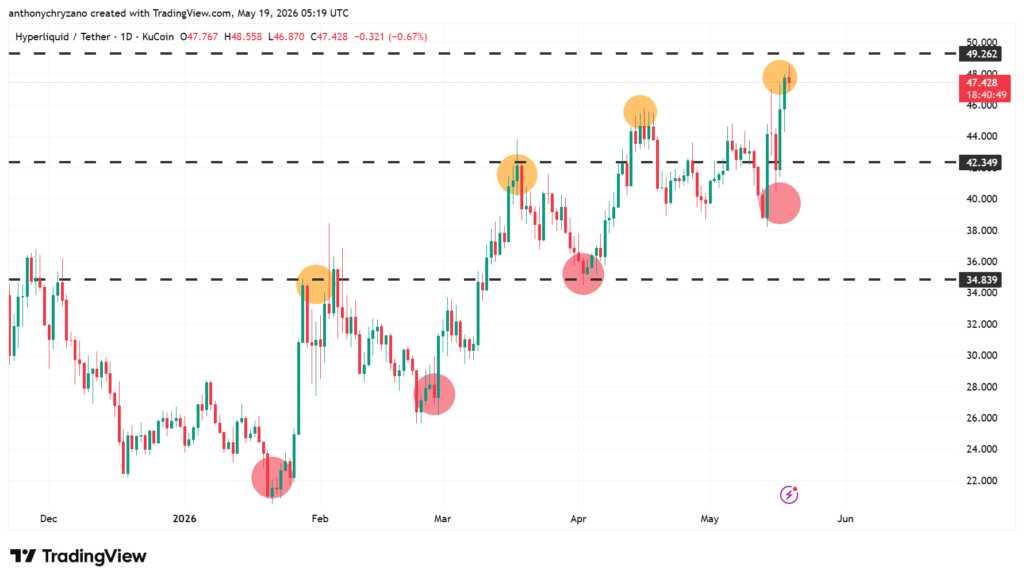
Psychologically, this structure reflects confidence and optimism. Instead of fear taking over during declines, buyers continue defending price at higher levels, showing that market participants expect further upside.
As long as HYPE continues maintaining higher highs and higher lows above the 50-day moving average, traders generally view the trend as bullish unless the structure begins breaking down.
Higher time frames confirm the rally status
Usually when a rally occurs on a daily chart, it is an accepted practice to check the status of the trend on the higher time frames. This method of verifying with the weekly or monthly timeframes erases all the jagged movements and noises involved in the lower time frame chart.
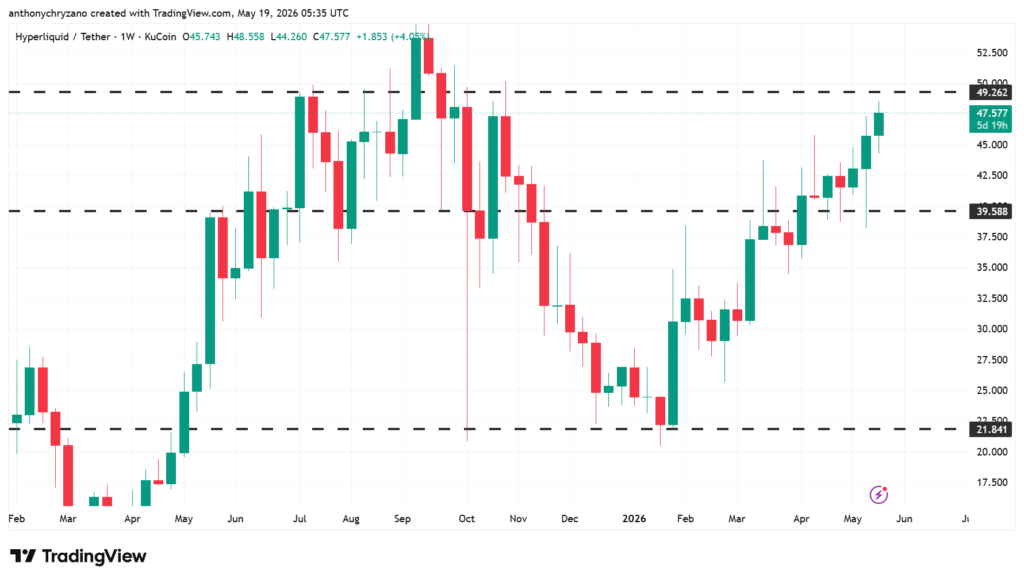
When observing HYPE’s prices, we also see the rise in the prices on the weekly charts. This shows that HYPE’s rally is far from a market in its excited state, but it is a legitimate move.
A rally that remains intact on higher timeframes often indicates stronger market conviction because it reflects participation from longer-term investors rather than only short-term traders chasing momentum. In many cases, hype-driven rallies tend to rise sharply but also collapse quickly as buying pressure fades.
However, when prices continue making higher highs and higher lows on the weekly timeframe, it suggests that buyers are repeatedly stepping in and defending the trend during pullbacks.
As far as traders’ behavior is concerned, short-term speculators will continue booking their gains when there are volatile moves, but major players and swing traders will stay in play as long as the bigger structure continues to stay intact.
There emerges a solid base under the uptrend since the demand is still not going away from the rallies. Instead of seeing a pattern of explosive rallies and explosive declines, we begin to see more of an accumulation and continuation pattern.