

Over the past 2 weeks, a strong divergence has surfaced in the Ethereum on-chain structure. It shows a clear difference between U.S. spot demand for ETH and Binance stablecoin flows, suggesting that a rally could be near for the second-largest cryptocurrency by reported market cap.
ETH teases rally as staking hits 32 percent
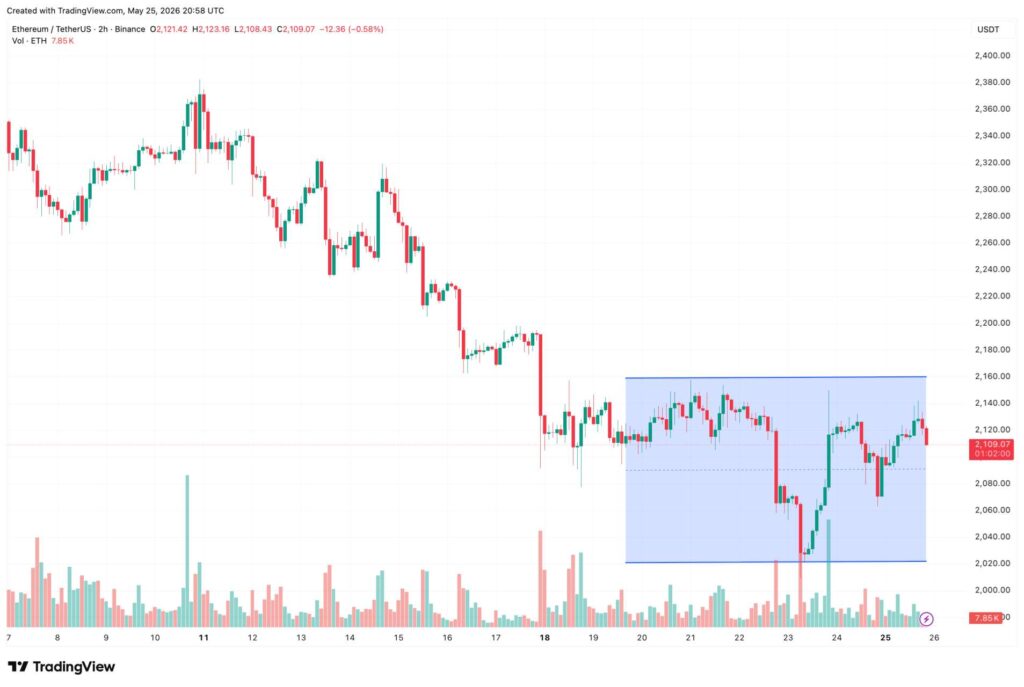
Between May 11 to 24, the Coinbase Premium Index has fallen from -0.02 to -0.12. This shows that there has been consistent sell-off by institutional investors, likely one of the causes behind ETH’s recent less than ordinary price action which saw it almost touch $2,000.
For the uninitiated, the Coinbase Premium Index measures the price difference between a digital asset on Coinbase and other major exchanges like Binance.
A positive premium usually signals stronger buying pressure from U.S.-based institutional investors, while a negative premium suggests heavier selling or weaker demand on Coinbase relative to global markets.
At the same time, the Binance average weekly USDT net outflows have surged above -215 million, showing a deterioration of 667 percent in comparison to the 90-day baseline figure. While at first this may force a trader to panic, there’s more to it than meets the eye.
The synchronized stablecoin outflow pattern from Binance shows that investors are engaging in structural capital rotation. For confirmation, one need not look beyond the Ethereum 2.0 staking percentage.
The Ethereum 2.0 staking rate has climbed throughout the cryptocurrency’s recent price correction when it tumbled from $2,339 to $2,097. Notably, the staking proportion reached a record 32.18 percent during this time.
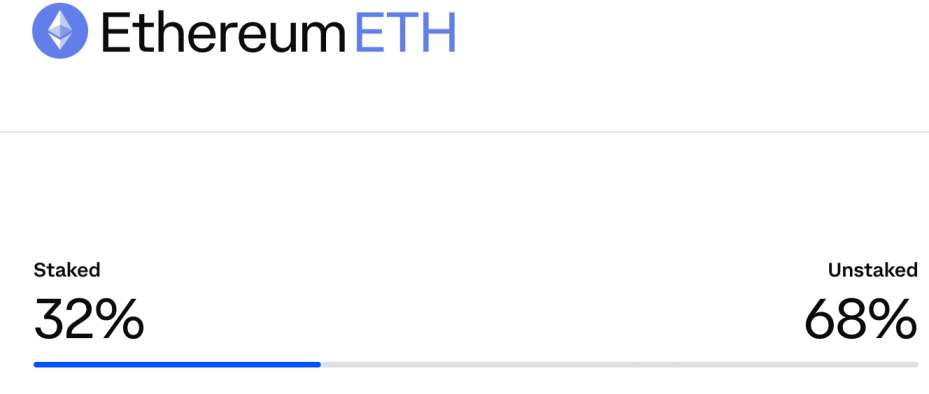
It shows that although market participants were moving assets out of exchanges, they weren’t doing it to sell. Rather, the intention was to allocate ETH into validator contracts. In simple words, the Ethereum network is absorbing the selling pressure by slowly reducing the liquid supply.
Is ETH price going down?
Although the Ethereum staking contract quotient has reached a historic high, several on-chain and exchange metrics point toward a deep correction for ETH. On May 19, ETH showed a pre-selloff pattern as the digital asset’s exchange supply jumped to 0.32.
Similarly, technical indicators such as the death cross and a bear flag suggest that ETH could fall all the way down to $1,075.
However, protocol-level advancements hold the potential to change the cryptocurrency’s fortunes for the better, and ETH bulls would want to believe that this year’s Hegota upgrade does just that.