DOGS had one of its most volatile daily sessions since its launch. After beginning the session at $0.0000589, it rose to an intraday peak of $0.0001054 and is currently changing hands at $0.0000826. At the time of writing, the asset is showing a rise of 40.24 percent for the day.
The candle is now showing up with a more interesting scenario. DOGS has spiked nearly 2x during the intraday session and then reversed around 45 percent of the move into the current price of the daily candle. That wick shape does not communicate continued bullish action. The asset is testing the overhead supply and still getting thrown back to the retracement levels. Over the next 48-72 hrs., the area in which the price consolidates will determine whether the 40 percent move throughout the session was momentum based on accumulation or a liquidity raid on the retail trader hoping for the spike.
The fibonacci zone doing the heavy lifting
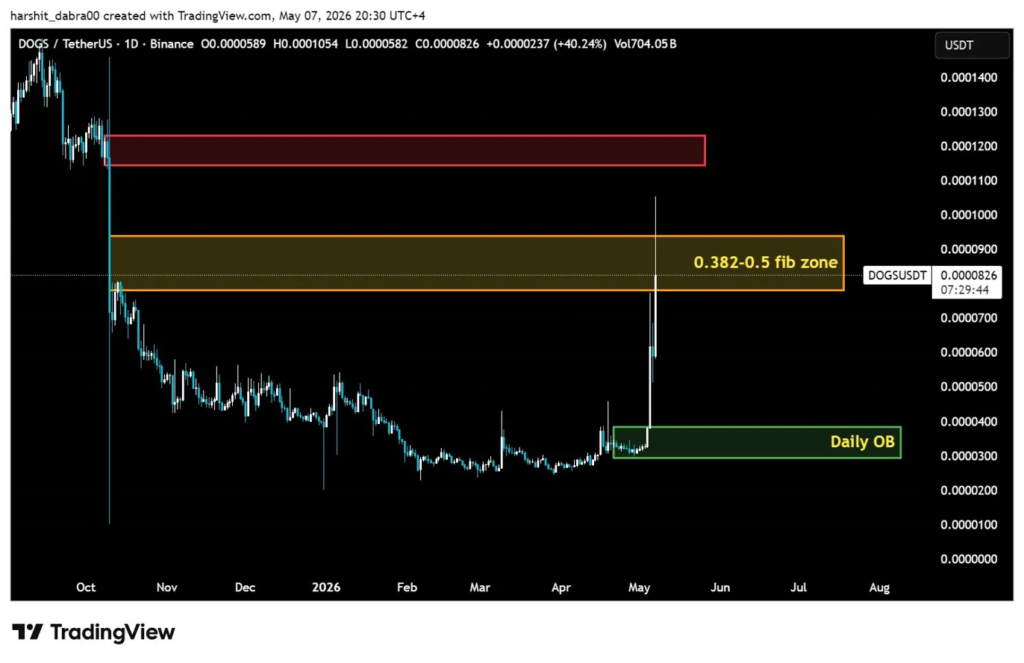
With the current price being close to $0.000083, one can notice that it is actually sitting in the middle of the 0.382 to 0.5 Fibonacci retracement levels, which can be drawn between the swing high of $0.00010285 and the swing low at $0.000054196. The 0.382 level comes in at 0.000084265, and the 50 percent retracement level is at 0.000078524. The price is currently 1.4 percent away from the 0.382 level and it is actually in that zone.
This is precisely what the daily chart calls a “key structure area.” The orange box shown on the chart encompasses the range of $0.0000800-$0.0000900, and it is obviously not by chance that the price halted here after the spike. Often a market retraces the halfway mark of a preceding move prior to trending out, and the pivot from the last session of $0.000080381 provides further confluence just beneath the current price, creating a layered support zone.
If sellers can push the price lower and it ends up below the level of $0.000078524 the 61.8 retracement at 0.000072782 is the next reasonable test. If that fails, the 78.6 level at $0.000064608 is then brought back into the picture.
Momentum divergence on the hourly
“1-Hour” indicates what the daily time frame is lacking to highlight. The 1-Hour MACD has a negative histogram (-0.0000017312), with the signal line (0.0000068305) above the MACD (0.0000050993 ). This indicates while the price remains above the pivot, short-term momentum has rolled over. The spike energy is now nonexistent.
RSI7 is in the lower region at 41.05 indicating short-term oversold readings. RSI14 at 53.83 and RSI21 at 57.05 indicate a medium-term view of not being oversold or overbought. A 40 percent daily candle being unable to achieve an RSI 14 reading of higher than 53.83 suggests the movement was rapid and the retracement was also very rapid leaving both indicators mid-range.
It appears that the size of the price movement versus the weak RSI reading implies that the rally was more on volume and momentum than the sustained buying pressure. A continuation trader would want to see RSI14 hold above 50 and then move above it. A fall below 50 on RSI14 after an action such as this chart would be acting as a red flag to go on the long side of the asset.
Moving average alignment and what it means for structure
The 1-hour moving average stack has a constructive situation, but the price sits precariously in the middle of it. The SMA7 at $0.000083972 and the EMA7 at $0.000083358 are within 1 percent of the current price. For the price to trade right under the short-term MAs is not a bullish stance, suggesting a stall at the point where near-term trend MAs should be acting as resistance.
The MA stack has tightened up beautifully and looks stacked: SMA200: $0.000043437; SMA30: $0.000073344; EMA30: $0.000076816; SMA7: $0.000083972. Price has broken all the way up through all of them. The challenge is that the price has retreated back down into the SMA7, which is the top level in the stack. Giving up that level and not immediately claiming it back represents a short-term structural breakdown no matter how bullish the long-term perspective.
Overhead resistance and the path to recovery
There is a daily red resistance area at approximately $0.0001200. Price had been rejected on several prior occasions at this level. The spike in price today failed to retest it when it made it to $0.0001054 and this carries decent significance. Both the 127.2 percent fibonacci extension from the measured move and the 161.8 percent extension from that measured move are at $0.00011609 and $0.00013292, respectively. Both of those levels exist inside of and above the red resistance zone. In order for the price to reach these extensions, the price has to get above $0.0001054 on conviction, and still the asset has not been able to do it.
The daily OB, on the chart is marked in green between approximately $0.0000300 and $0.0000383. It is deep below the current price and represents the base on which the move was initiated. The only context that it could be of any relevance to price would be a reference for a macro support if the whole move ultimately fails.
Volume context
The volume of $296,420,000 in the session is huge for a token of this price point. A large wick on a candle has long been interpreted as both sides participating, aggressive buyers and sellers meeting aggressively around the high, and not necessarily a clear sign of distribution, but it shows that $0.0001054 was defended by the buyers’ side.