BuildOn (B) has had one of the more violent rallies in the mid-caps recently, rocketing from a cycle low of around $0.086 up to intraday highs of $0.483 as of today. That’s up 462 percent from the lows of this cycle. The token currently trades $0.390, down 7.44 percent on the day. Today’s daily candle, which opened at $0.422 and tagged $0.483 on the upside, crashed to lows of $0.284, before closing in the middle of the range.
The chart is speaking a specific narrative; it is not highlighting “strong uptrend, overbought, wait for a dip.” Price is literally inside a supply zone that demolished this token the last time it arrived.
The red box is the whole story
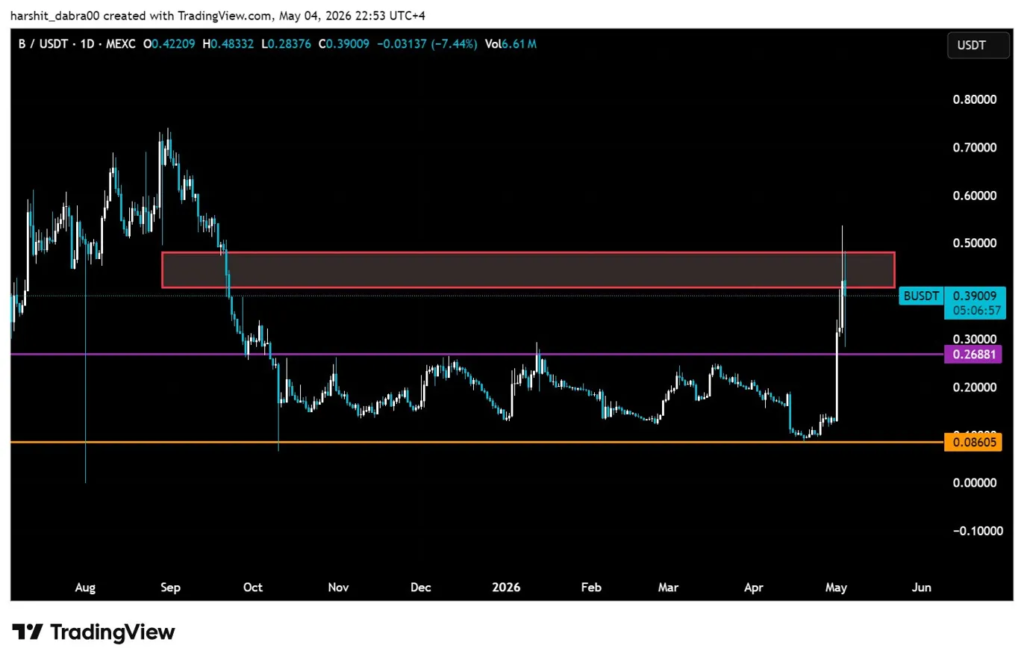
From the chart you can also observe a clear resistance zone spanning approximately between $0.41 and $0.48, which was where B remained during the early stages of September 2025 prior to the breakdown, which subsequently drove it from highs of $0.73 all the way to $0.086 by April 2026, an 88 percent drawdown over some seven months.
Following that long capitulation, B remained between $0.15 and $0.30 for the majority of the latter part of 2025 and into early 2026. That lower range had its bottom on tests of the purple level at $0.26881 and its absolute bottom on the orange level at $0.086 which acted as a final floor in April 2026 before the move vertically.
The price today at $0.390 is once again inside that September supply zone. The people who sold at some point between $0.36 and $0.50 during that prior distribution will be at, or near, their break-even point. That is not a neutral situation; that Short,is an exit point.
What the indicators say, and why the RSI reading demands attention
The moving average stack is a clear bullish call on the daily. The SMA7 at 0.23 is far above the SMA30 at 0.16 and the SMA200 at 0.18. The EMA structure is the same story: EMA7 at 0.26, EMA30 at 0.18, and EMA200 at 0.20. Short above medium, above long ones. The trend follower is justified in calling the structure intact.
The MACD supports the idea that there’s momentum behind this. The histogram is +0.03396, which is quite high positive and the MACD line (0.03665) is well above the signal line (0.00268). The daily momentum seems to be still moving higher.
But RSI is flashing the other signal. The RSI-7 is 94.08. RSI14 is 85.82. RSI21 is 79.82. RSI readings across all the time frames are extremely overbought. The RSI7 level of 94 typically signals an imminent sharp short-term pullback even on a strong trend. It doesn’t necessarily mean that the trend is going to end; it indicates how much euphoria is already baked in to the market at an extremely fast pace.
The intraday pivot is $0.42305 and $0.3900 (the current trading point) is below. The immediate bias looks to be mildly bearish for the upcoming session.
BuildOn: The Fibonacci levels that actually matter
Using the Fibonacci retracement drawn from the swing low at $0.0878 and the swing high at $0.5304 provides some initial points for consideration on the immediate outlook. The 23.6 percent retracement level of $0.43 can be found on the underside of the last cluster of highs and the red box resistance upper border. Under that we see the 38.2 percent level of $0.36 acting as the first pullback zone.
Moving further down, the 50 percent at $0.31 is a stronger support. The 61.8 retracement is sitting right on the purple line at $0.26881 that contained the whole consolidation phase lasting months. Complete 78.6 retracement level is at $0.18 and is where the SMA200 and EMA200 currently sit. Extension target areas are $0.65 (127.2 percent), $0.80 (161.8 percent) and $0.97 (200 percent), respectively.
Right now the important level for buyers is the $0.36 one. Buyers holding that level on any pullback maintains the constructive structure. A firm break under the $0.31 level suggests the market has outright rejected the red box, and the near-term target would revert back to the $0.26, and then likely $0.18.
Volume and market cap context
The volume in 24 hours of $144.67 million and market cap of $390.66 million results in a volume/market cap ratio around 37 percent. This is extremely high and also points out the high activity, speculation, and liquidity but suggests movement driven by hot money and not steady accumulation. Ten to thirty percent moves are entirely possible on a single session on either side at this volume profile.