The BNB coin has broken through a major resistance level and is currently near another significant psychological resistance level. The coin’s price shot up by 16 percent following an announcement on Binance’s official X handle, which stated about a new product reveal on June 1. The coin just fell short of hitting the psychological resistance level of $750.
The world’s largest crypto exchange, Binance exchange’s native coin BNB, spiked sharply during the past two days. Interestingly, a post on X of a heap of hay on a golden background, captioned ‘New product reveal on June 1,’ seems to have caught the attention of the BNB community. After this was posted on X, the traders started going into a buying spree, and the prices have risen vertically.
As shown in the chart below, BNB is currently testing the 200-day moving average after the above was posted a couple of days ago. This spike is quite abnormal, as the token rose from nearly $650 to its current price of $725, which is above the 200-day moving average.
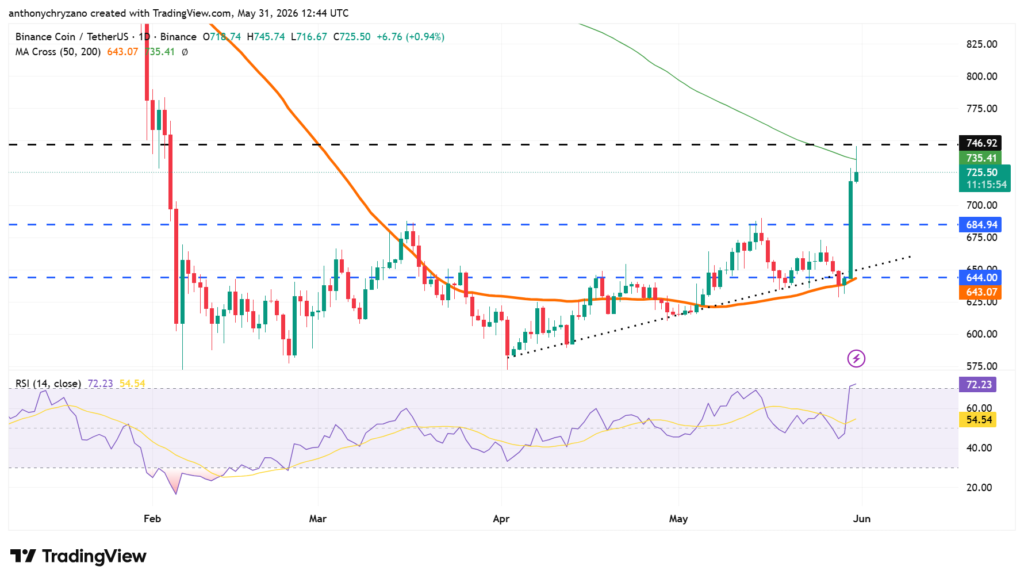
The 200-day moving average (200-day MA) is considered one of the most important indicators for traders because it reflects the market’s long-term trend and overall sentiment. It represents the average closing price over the last 200 trading days, which smooths out short-term volatility and gives a broader view of price direction.
When the price trades above the 200-day MA, traders often interpret it as a sign that the asset is entering or maintaining a bullish phase, with buyers gradually gaining control. This can improve confidence and attract more participation from both retail and institutional traders.
On the other hand, when the price remains below the 200-day MA, it is generally considered a sign of weakness or a prolonged downtrend, where sellers continue to dominate. Because so many market participants monitor this level, it often acts as a psychological support or resistance zone.
When an asset breaks above the 200-day MA after trading below it for a long period, buying activity can intensify as traders view the move as confirmation that momentum is shifting and the market structure may be improving. Likewise, rejection at this level can reinforce bearish sentiment and lead to further selling pressure.
With the BNB prices rising above the 200-day MA, the market was elated. However, the relative strength index indicator flashes an overbought condition. This means the BNB is overvalued, so a market correction and price retrace are possible.
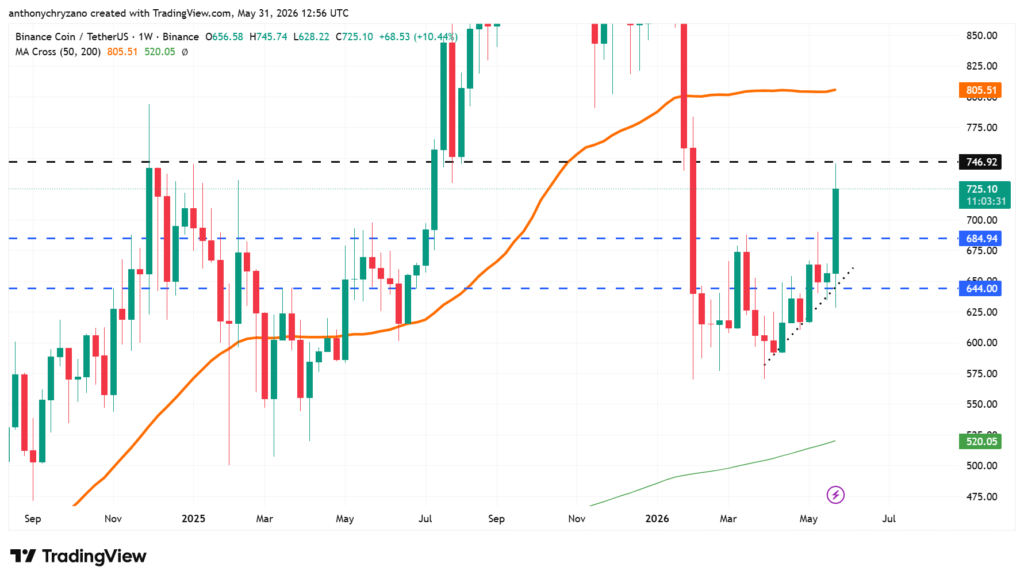
Going by the weekly chart, BNB has crashed below the $650 support level every single time the price hit the resistance level at $750. As the prices are currently facing resistance at the same level, there is a high chance that BNB could reciprocate this same price action in the coming days.