The reason for Bitcoin’s April rally has been discussed largely in macro sentiment shifts and institutional positionings. On-chain data provides a more detailed background. It’s one about where dry powder is currently stored, where dry powder came from, and why two instances of the same stablecoin are performing in opposite directions.
The SSR has flipped into absorption mode
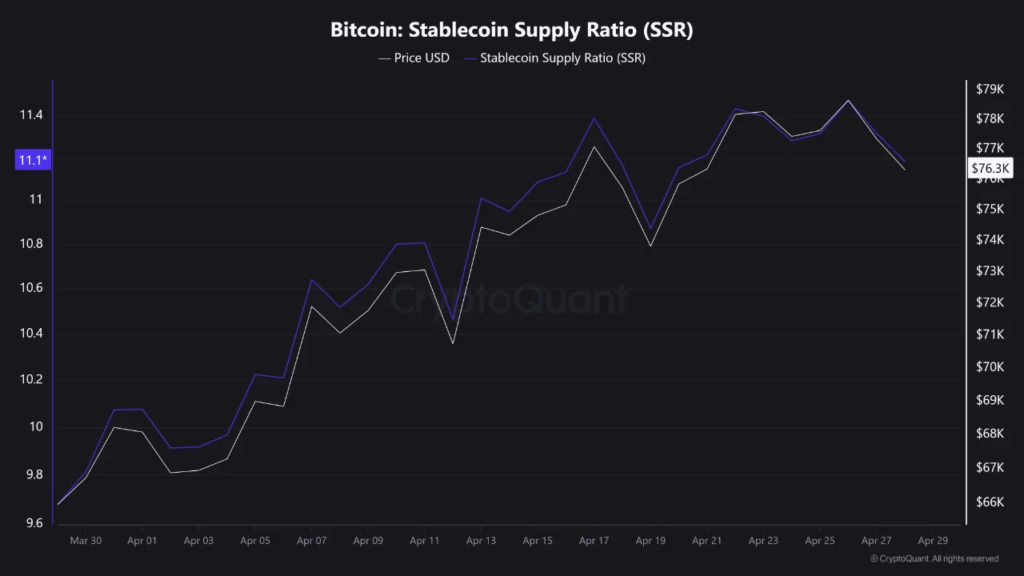
The Stablecoin Supply Ratio (SSR) compares Bitcoin’s market cap to the total stablecoin supply. When the SSR is falling, the purchasing power of stablecoins is increasing compared to Bitcoin’s price, indicating building hidden demand. When the SSR is increasing, it means that capital has been deployed, Bitcoin has appreciated, and there is less stablecoin purchasing power relative to Bitcoin’s market cap.
By March 30, SSR was at around 9.64 while Bitcoin was at about $66,000. SSR eventually went to a local peak at 11.4 toward the end of April and then held at 11.1 while Bitcoin reached $76,300.
This 15 percent jump in SSR over the course of 30 days lines up almost perfectly with Bitcoin’s 15.6 percent increase in price over the same 30 day span. They follow one another; that is the key. As the price increased, it devoured the buying power from stablecoins that had accumulated during the end of March compression. The rise in SSR back to 11.1 indicates the start of a demand absorption phase, where the money available at the lows is mostly gone.
What this means in practical terms is very simple. For Bitcoin to make a serious move to the upside from here, the cycle will have to start over again, and stablecoin supply in relation to bitcoin market cap will have to expand, either by new stablecoins being minted, a price dip in Bitcoin that decreases the denominator, or both. Neither is happening now.
Nothing in the SSR chart is suggesting an immediate bullish driver. All it’s telling the market participants is that the rally that occurred during April was genuine and driven by demand. That information is of some use but it’s retrospective information. The forward-looking read is more muted in that the immediately available buying power has been depleted. The market has to reload for the next push.
Binance netflow: capital deployed, then paused
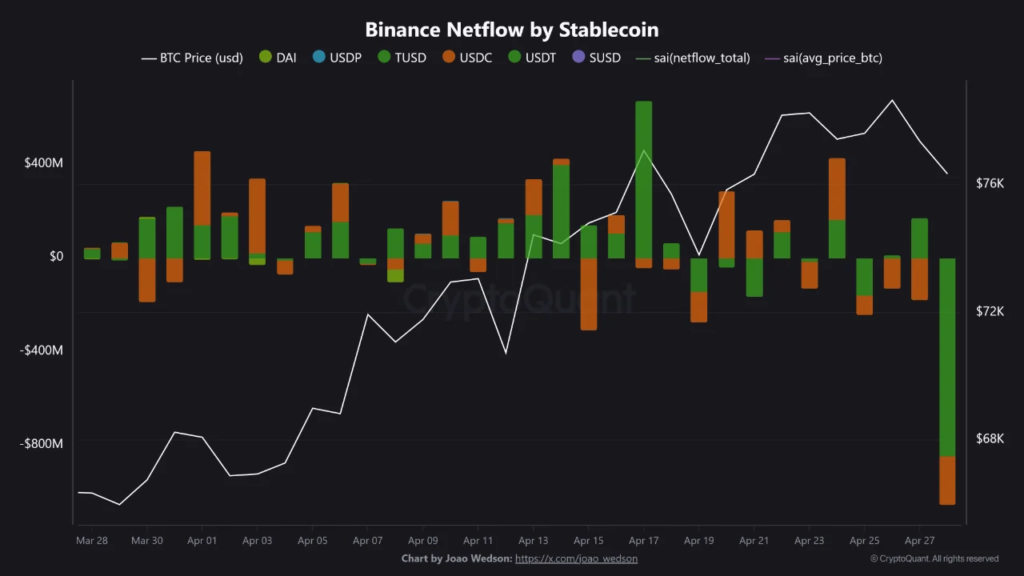
Aggregate Binance stablecoin net flow completes the SSR narrative. Throughout the end of March, aggregate stablecoin net flow into Binance has been very negative. It is nearly -$900 million at its bottom, meaning that stablecoins are leaving, not entering, the exchange.
The negative net flow is bullish under the circumstances, which means money was leaving Binance in stablecoins and going somewhere, likely converting to spot BTC, or moving out. Combined with the falling SSR during that time, we have a market being positioned for a movement.
Over April as Bitcoin moved from $66k up towards $76k, net flow became more fragmented. Some days showed positive net flow back onto exchanges and others remained negative. Dominant stablecoins driving these movements were USDT and USDC, with the net flow for USDT (green bars) being larger of the two.
Towards the end of April (Apr 28-29), the chart has another negative sharp USDT bar with the stablecoins moving out of Binance yet again. It’s not possible to distinguish between fresh deployment or withdrawal for custody with only this information alone, but the late-month outflow trend is reminiscent of the run-up from March to April and should be observed closely.
The ERC20/TRC20 divergence is not a footnote
Tether operates on many blockchains. In particular, two large networks: on the one hand, Ethereum (ERC20) and, on the other, Tron (TRC20). These cater to different audiences, different geographic areas, and, to a growing extent, different risk categories.
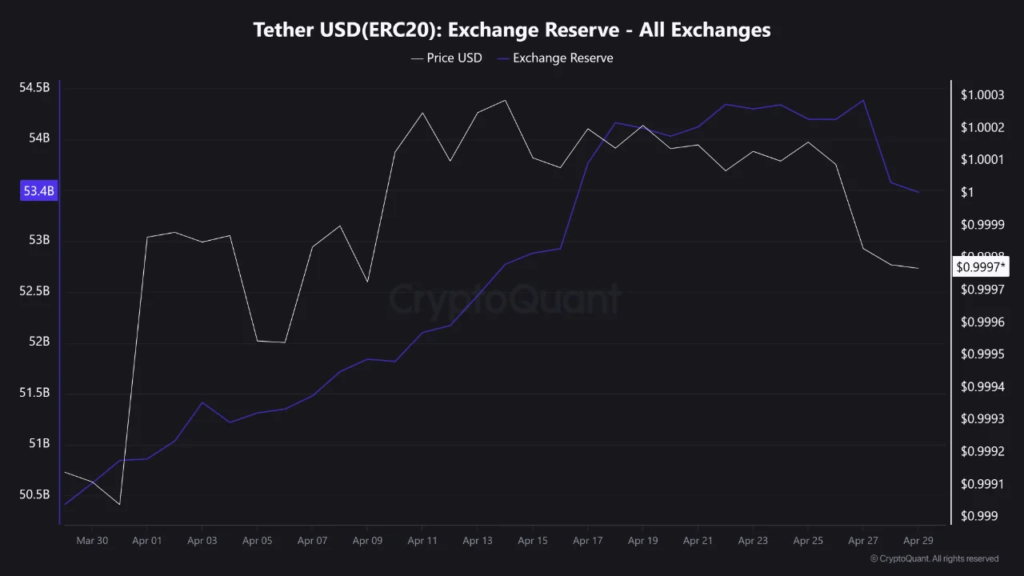
ERC20 USDT exchange reserves increased from ~50.5 billion on March 30 to ~54.5 billion by mid-April. ~4 billion increase in under 3 weeks. Reserves ended the month at 53.4 billion. Overall 30 day net gain is ~2.9 billion.
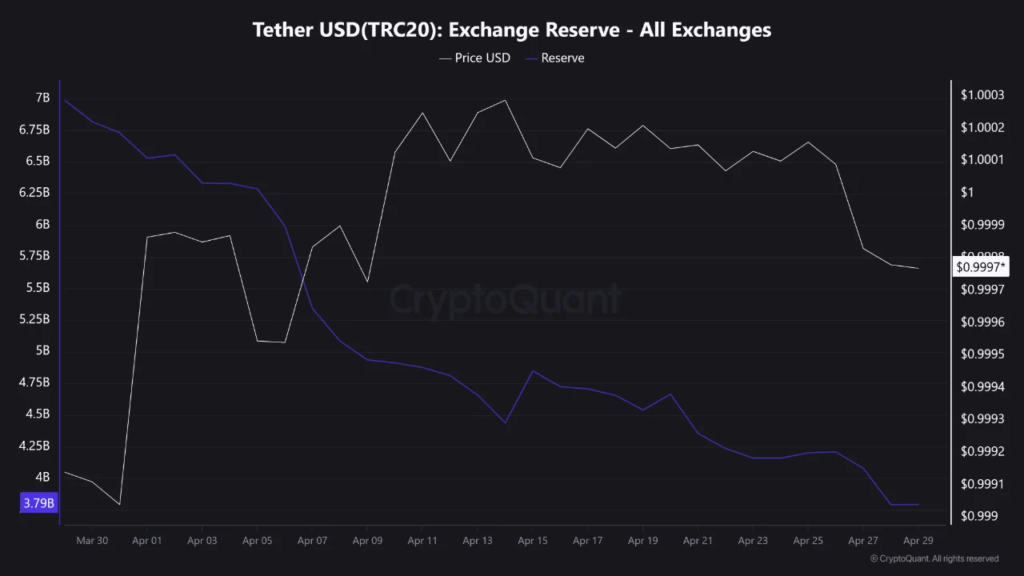
TRC20 USDT exchange reserves did exactly the reverse. It went from the $7 billion range (around Mar. 30) to $3.79 billion on April 29, with a consistent downward trend. This represents a 46 percent fall in 30 days.
These two assets are identical in denomination. Both are Tether. The divergence is not about what the stablecoin is; it’s about where it lives and who is using it.
Historically, TRC20 USDT has dominated P2P and remittance corridors and the infrastructure for retail trading in emerging markets. Transaction fees were low on Tron, making it the obvious rail for high-volume, low-value transfers. However, this is not the case following Dencun on Ethereum in March 2024 which significantly lowers fees on Ethereum L2s. Moving USDT across Ethereum or an Ethereum L2 is no longer inherently more expensive than moving it across Tron.
In tandem, institutional flow into crypto has significantly sped up after the U.S. Approvals of spot ETFs. Institutional capital is not TRC20-denominated. It operates within regulated structures and has an affinity for Ethereum-native infra, audited contracts, compliant custody rails, and regulated engageability. Since institutional inflows have only been increasing, the pull towards ERC20-denominated liquidity also has been increasing in equal proportion.
The 46 percent decline in TRC20 exchange reserves is not a single-cause story. It reflects compressed cost advantages, regulatory headwinds around the Tron ecosystem, and a secular preference shift among sophisticated capital toward compliant infrastructure. Taken together, it suggests the competitive moat that Tron built on low fees is meaningfully narrower than it was 18 months ago.
The ERC20 gains confirm the other side of the trade. Capital is not leaving the stablecoin ecosystem; it is migrating within it toward networks that meet a higher bar for institutional acceptability.