Bitcoin is currently trading at $65,061.51 with an intraday dip of 0.72 percent a week to price in a rise of 1.45 percent for the past 7 days to price with the current daily traded volume at $22.18 billion and a market cap of $1.31 trillion. It has been a peaceful-looking surface week. However, under that, the asset has continued to fight until mid-July.
Price keeps testing the same wall and keeps failing to hold above it. That one fact holds more weight than any weekly percentage gain.
The bulls are defending the support and sellers are capping gains
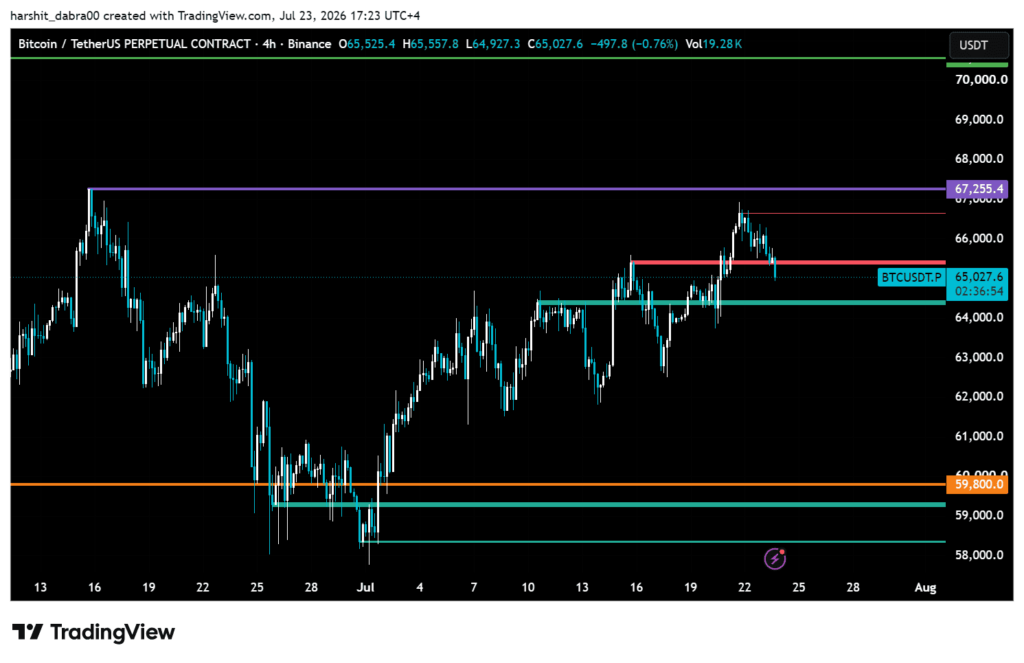
Bitcoin is caught between $64,000 and $67,255. Since Monday, July 16, sellers have pushed back every approach toward $67,255, most recently pushing towards $67,000 in yesterday’s late-day trading action and failing out at $66,910 to dip down towards $65,027 again. Support near $64,000 has bounced twice during July, but bulls just don’t seem able to get the last high cleared now. The next support below the present block falls at $59,800, and it seems highly likely to come into play if the current range finally breaks.
The daily pivot of $66,103 is a key level for the next move that we see. The price is below that which makes short-term bias a neutral-to-bearish bias. Close to here, near $64,748, we have a 23.6 percent Fibonacci level too, which could act like a support level. Above the daily pivot of $66,103, the way to target $69,402 could be opened and below June lows at $63,410, the current bounce could not be sustainable.
The momentum for Bitcoin remains bullish with no confirmation of a long-term trend
The RSI shows a continuing short-term trend of momentum: the 7-day is at 66.67, the 14-day at 59.36, and the 21-day reading is 54.36, and all are over a reading of 50, but none come close to a 70s RSI level, indicating overbought parameters.
The other momentum indicator, MACD, which continues to fuel momentum, reads at 597.41: our MACD line reading of 597.41 is well above its signal reading of 203.99, and its MACD histogram is even reading a higher 393.43.
However, the longer term trend continues to be weaker, with the longer run of movement represented by the 200 day SMA lying at $72,687.42 more than 11 percent above the price point. Furthermore, Bitcoin continues to stay close to both its short term 7 day and 30 day SMAs which presently are located at $65,001.73 and $62,786.35 respectively. This is depicting the market participants about the present consolidating condition of this digital gold.
ETF inflows stay strong, but the price action is lagging
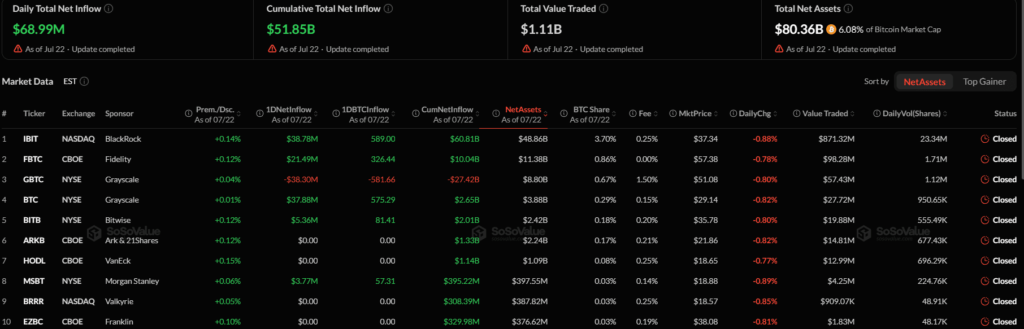
Spot bitcoin ETFs took in $68.99 million in net inflows on July 22, keeping cumulative net inflow at $51.85 billion since launch and total net assets at $80.36 billion, 6.08 percent of bitcoin’s market cap. The daily number hides a split: IBIT added $38.78 million and FBTC added $21.49 million, while GBTC lost $38.30 million, continuing a redemption pattern running since conversion. Money is rotating between products more than entering the asset class fresh, with growth coming from newer, cheaper funds pulling share from the older, higher fee structure. Capital kept entering ETFs the same week bitcoin failed to clear resistance twice, so the ETF bid alone is not forcing a breakout on its own.
The market made the move but Tesla’s Bitcoin holding did not
Tesla disclosed its bitcoin treasury, held at 11,509 BTC in the second quarter. The company says since 2022, they’ve been holding bitcoin. They marked down the balance sheet by $112 million after-tax in impairment as Bitcoin declined roughly 14 percent that quarter, going with a correction from ~$83,000 to ~$58,000 (and rising again to where the asset is changing hands).
It points out just how little action many of the largest Bitcoin corporations have been taking on Bitcoin trades at this price level over many years.