

Following a brief surge to $1,947 on Wednesday, Ethereum (ETH) has once again failed to tap the psychologically important $2,000 price level. As of Thursday, the second-largest cryptocurrency by reported market cap is trading at $1,902. However, a key indicator suggests that the digital asset may be on the precipice of a major bullish rally in the coming days.
Ethereum MVRV indicator teases golden cross
According to a Thursday X post by seasoned crypto trader Ali Martinez, ETH is quietly approaching a bullish crossover on its market value to realized value (MVRV) ratio against its 160-day simple moving average (SMA).
For the uninitiated, the MVRV ratio compares Ethereum’s current market capitalization with its realized capitalization to estimate whether the asset is trading above or below the average cost basis of all coins in circulation.
A high MVRV ratio suggests many holders are sitting on large unrealized profits, while a low MVRV ratio indicates holders are closer to breakeven or losses, conditions that have historically been associated with market bottoms.
In the same vein, the MVRV Momentum tracks the relationship between aggregate holder profitability and its medium-term trend line.
When the daily MVRV ratio breaks back above its 160-day SMA, it confirms a transition out of capitulation and signals the start of a renewed accumulation regime. Past data suggests this assessment.
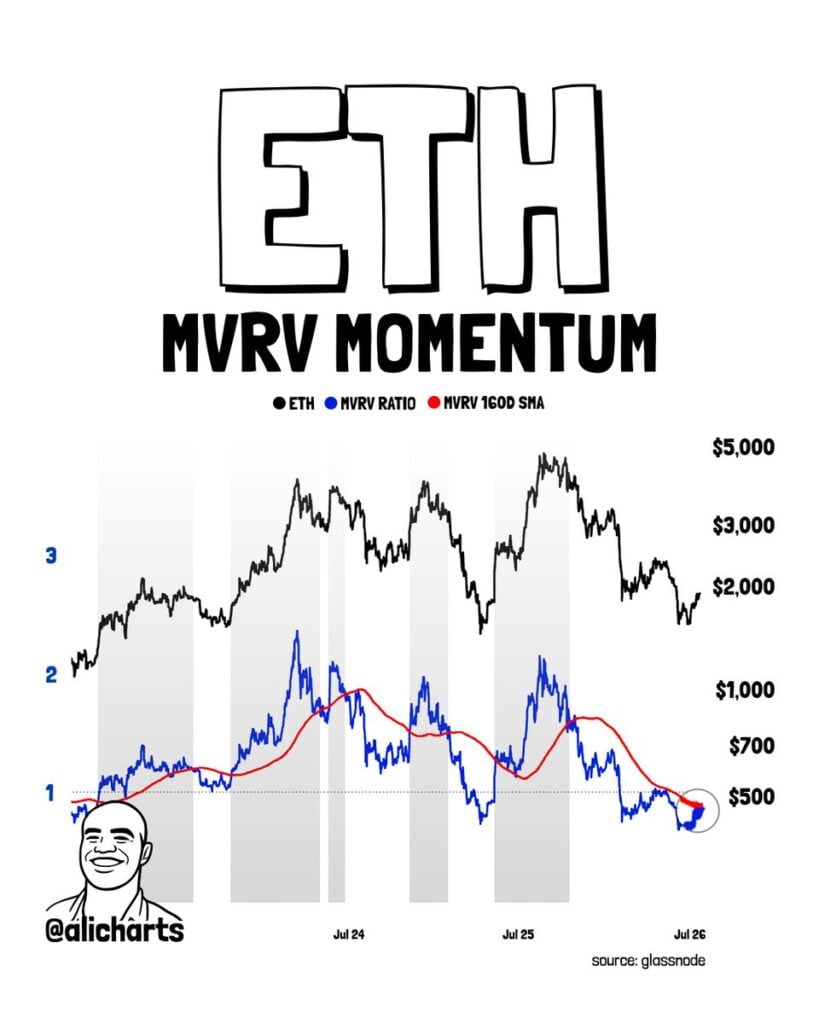
For example, over the past 3 years, a sustained bullish crossover above the 160-day SMA has consistently preceded major price recoveries for ETH by marking the end of distribution phases.
Once again, ETH is starting to flash the so-called ‘golden cross’ – suggesting that a reversal could be looming.
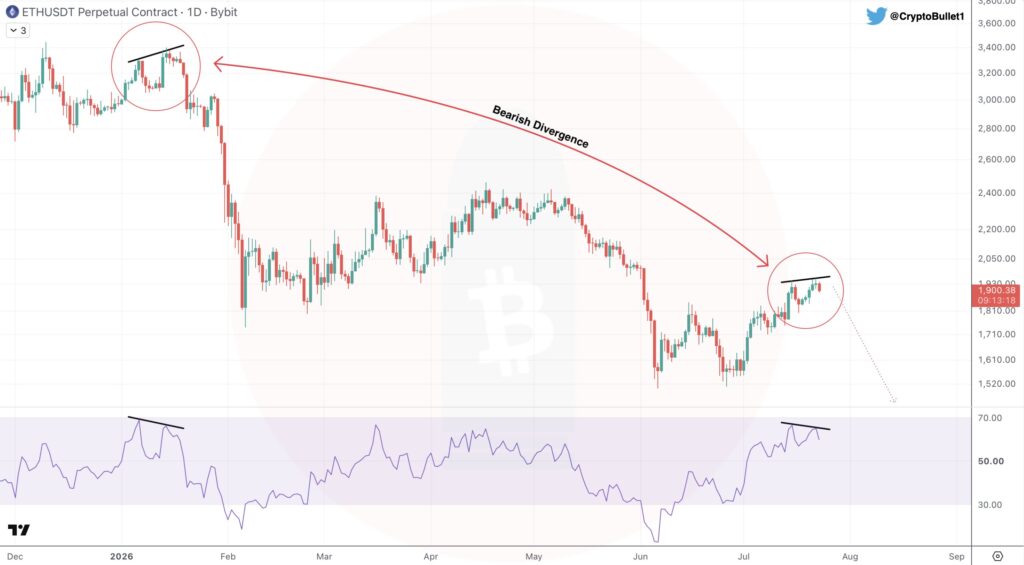
Offering a contrasting take, crypto analyst CryptoBullet shared the following ETH daily chart, saying that the cryptocurrency is forming a classic bearish divergence last seen at the beginning of 2026 – resulting in a decline from $3,400 to $1,850 within weeks.
ETH holders should remain watchful
While the emergence of a golden cross is a bullish development, there are some concerns about the potential fall of ETH in the coming months. On July 9, ETH repeated a liquidity pattern that previously preceded a 30 percent drop.
On a more recent scale, on Wednesday, ETH price tested channel resistance on the daily chart. A rejection from the channel resistance price level could push ETH back down to $1,600 level.