

Bitcoin may be moving closer to a cycle bottom as more than half of its circulating supply now sits at an unrealized loss, according to K33 Research.
In its H1 2026 round-up, K33 said more than 50 percent of Bitcoin’s circulating supply is now held at a loss, a level that has often appeared near past cycle bottoms.
At the time of writing, BTC traded near $63,100, up 2.14 percent over 24 hours (according to The Coin Headlines market data). The asset had a market cap of $1.27 trillion and remained below its all-time high of $126,080, recorded on Oct. 6, 2025.
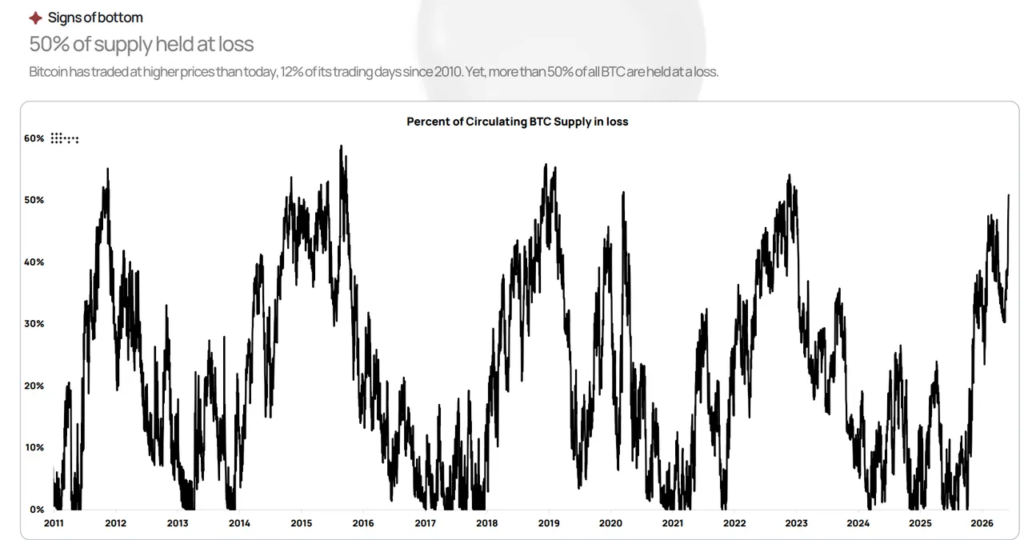
K33 said the current drawdown followed a weaker and less aggressive bull market than earlier Bitcoin cycles. Because of that, the firm said the present bear market may also be less severe than older cycles.
It added, “we now believe the worst of the drawdown is likely behind us,” while still noting that the four-year cycle leaves room for more downside.
Past loss signals came before major bottoms
The loss-supply signal has drawn attention because it appeared near previous BTC bear-market lows. K33’s slide deck shows that BTC bottomed 31 days after the signal in 2011, 23 days after the signal in 2018 and 13 days after the signal in 2022. The 2014 cycle took longer, with a bottom 101 days after the same condition appeared.
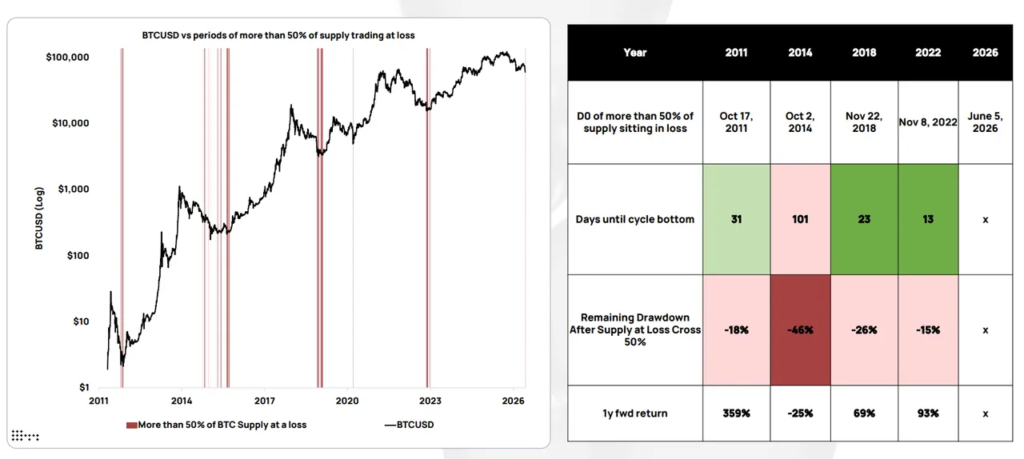
The same K33 data also shows that one-year returns after the signal varied across cycles. Bitcoin rose 359 percent after the 2011 signal, gained 69 percent after the 2018 signal and climbed 93 percent after the 2022 signal. However, 2014 was the clear exception, with BTC down 25 percent one year later.
K33 also pointed to another rare setup. The firm said Bitcoin ended the first half of 2026 close to its 200-week moving average. Its chart showed similar moments around 2015, 2018, 2020 and 2022, although the 2022 market stayed below that moving average for more than a year.
ETF flows remain a key pressure point
Bitcoin’s bottom signal comes as ETF flows remain mixed. As we reported today, spot Bitcoin ETFs logged $265.69 million in net inflows, lifting accumulated inflows to $51.34 billion and total assets under management to $77.32 billion. IBIT led that day with $209.40 million in inflows, while GBTC saw $44.45 million in outflows.
However, June remains a weak month for ETF demand. U.S. spot Bitcoin ETFs saw about $4.5 billion in June outflows, marking their worst month since launch. That followed a 10-day outflow streak before the funds returned to inflows in early July.
Moreover, Citi cut its 12-month Bitcoin forecast from $112,000 to $82,000. The bank cited weaker ETF flows, slower U.S. crypto law progress and concern over possible selling by digital asset treasury firms.
Bitcoin bottom calls grow as losses deepen
Social media traders have also started calling for a BTC bottom, though their views remain market commentary rather than verified research.
Chiefy compared Strategy’s latest Bitcoin sale with its 2022 activity and claimed that the setup looked similar to the period before BTCs previous cycle low. Merlijn The Trader also said Bitcoin had entered the lower bands of a rainbow chart for the fourth time.
Moon Market took a different angle and said BTC may be starting to decouple from stocks. The trader argued that capital could rotate from AI, semiconductor and memory stocks into
Bitcoin after sharp gains in those equity sectors and a 50 percent BTC drawdown. This view remains unconfirmed and depends on whether demand returns to spot markets and ETFs.
Meanwhile, the AI rotation theme has also appeared in broader market coverage. In June, BTC had lost ground while investors moved toward AI-linked stocks and major IPOs, with semiconductor shares rising sharply over the prior year while Bitcoin fell.
Recently, Bitcoin regained price strength while Solana and Ethereum led the broader crypto rally. In addition, Bitcoin held above the late-June $58,000 area and traded near the $63,300 zone, where traders were watching whether it could break higher or lose support again.
Elsewhere, Strategy’s earlier 32 BTC sale became part of a Polymarket dispute after traders challenged how the prediction market settled a bet tied to whether Strategy sold Bitcoin before May 31. That event kept Strategy’s Bitcoin activity in focus during a period when large holders and ETF flows were already shaping market sentiment.
K33’s data suggests BTC has entered a zone that has often appeared near past bear-market lows. Still, ETF flows, treasury-company selling, and broader risk appetite could decide whether the current signal marks a real bottom or another pause in the 2026 downturn.