Bitcoin is currently trading at $81,065.48 down 0.16 percent on the 4-hour candle; the session high was at $81,180.00, with a market cap of $1.62 trillion. The price action is currently sitting on top of a rising trendline, holding from the 2nd april lows around $65,600 all the way up, a structure of higher highs that has held for approximately five weeks. On the same scale, there’s an evident resistance zone at $87k-$88k just above the price before the next level in the $94k range. How BTC reacts with that zone over the next few weeks will either confirm Tom Lee’s bull market thesis or be its first substantial structural threat.
Bitcoin’s current chart structure
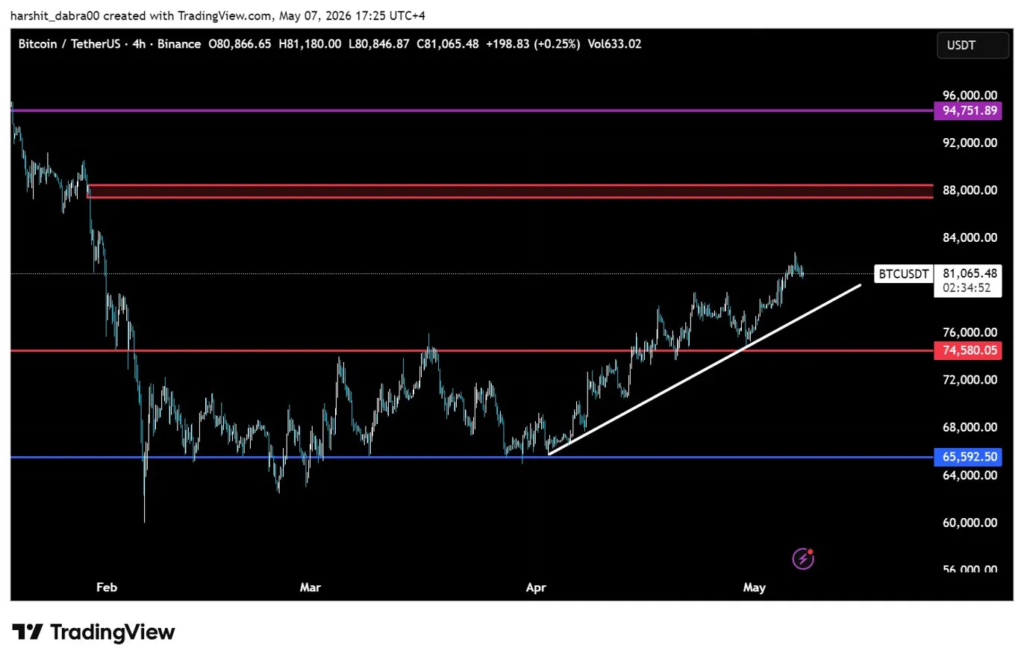
The present situation is composed of three horizontal levels on the 4-hour timeframe. The biggest support floor is $65,592.50 (blue line), the floor from the February to April consolidation phase that has not been significantly tested until now. Then closer to this part there is the $74,580.05 level (red line), the level that has served as resistance until the first weeks of March and then was reclaimed in the last week of April and acted as support for the recent move up.
Above that, the structure is not as clean. The $87,000-$88,000 red zone of resistance is an old consolidation range that was broken by sellers in Jan/Feb as price moved down. That range now acts as the first real area of supply above price that sellers that purchased at that range and weathered the drawdown will begin selling. If price can successfully take out $88,000 with volume, the next known level could by around $94,500.
The most key near-term structure to watch here is this uptrend line from the April lows, which Bitcoin has continued to bounce from throughout the multiple retests. While we stay above this level on pullbacks, the bias is upward. A breakdown of this level and the $74,580 level would be an indication of change in the asset’s character.
Tom Lee’s bull market signal and what the data behind it says
This week in Los Angeles at the Milken Conference, Fundstrat’s Tom Lee, making a structural call based on one clear indicator, noted that Bitcoin has never closed three consecutive positive months in a bear market. With two months closed and a third open and positive, he has determined that we are not in a bear market: “Bitcoin’s never been up three consecutive months in the middle of a bear market, so it actually, in fact, marks the start of a bull market.”
The two months of streaks are confirmed by Dow Jones Market Data. At still 35 percent below the all-time intraday high of $126,272 achieved in the wake of October 6, 2025’s closing prices, the rally, while significant in its structure, still has further to go before getting near its previous marks.
Lee also pointed to a bullish signal from John Bollinger of Bollinger Capital Management, inventor of Bollinger Bands. His Bitcoin trend model turned bullish this week and his Tactica program is fully invested as of the current state. It should be of interest that two independent technical systems are in agreement in their direction for the week.
The institutional component, which Lee highlighted, provides background to the price configuration. In meetings with crypto exchanges, he noted a shift in client behavior where institutions have been scaling to the long side. This observation matches what this chart reflects. It highlights a controlled rally contained by trendline support, instead of a wild upward move driven by speculation. Institutional-led markets typically establish higher lows and move gradually rather than in large jumps.
Lee’s call on Ethereum, predicting that gains will be “stronger by the end of the year,” also raises a potential conflict of interest that the market participants should focus on. He also chairs BitMine Immersion Technologies, a company focused on Ethereum treasury. The bitcoin call doesn’t come with similar conflicts and should be assessed as is.
There is still a question for $88,000
This 3-month signal Lee refers to is the macro indicator of joining the bull market. The chart indicates it may take time but for the market participants, this question still persist:, will Bitcoin be able to eat up the supply sitting at $87,000-88,000?
From the price level of $81,065.48, that band is about 8 percent away. The price between now and $88,000 is structurally open on the chart with no significant horizontal resistance. The trend line, assuming it holds up, would serve as continued support. The more important thing to answer isn’t if bitcoin can reach $88,000, but rather if it can maintain that position on a volumetric close, indicating demand rather than an overshoot.
And if it does, then the discussion moves to the $94,700 zone. As long as ~$74,500 holds, the framework of the chart is supportive even if it pauses and turns back down. A loss of $74,580.05 on a closing basis would be the first sign that Lee’s theory that the bull market started here should be reassessed.