


Bitcoin is trading at $77,033 at the time of writing on the daily timeframe and has pumped 1.00% over the last 24 hours. On the face of it, the setup is bullish. Under the surface, though, we are somewhere between a clear breakout and a classic theoretical failed retest.
Bitcoin: Technical, self-contained, waiting
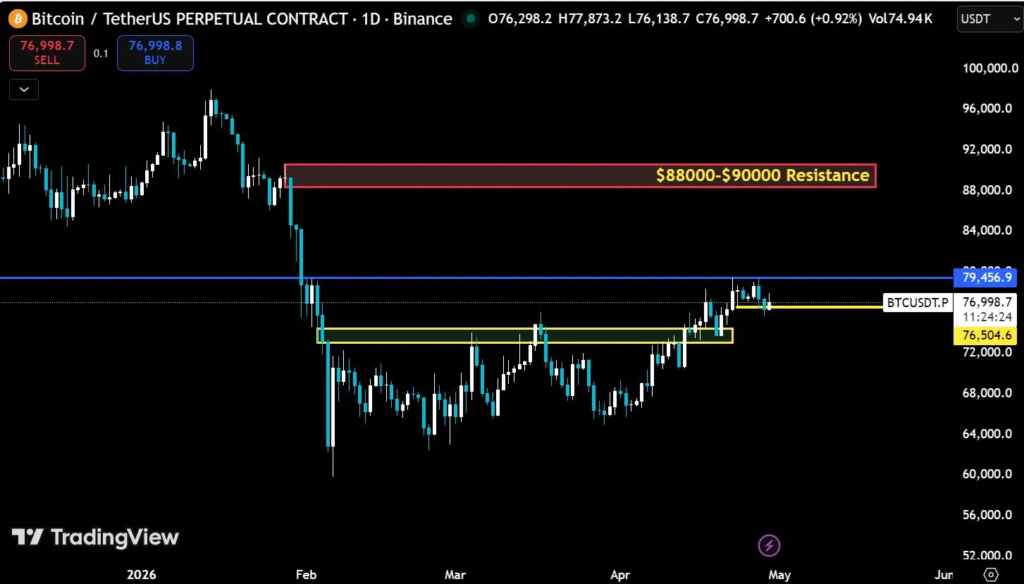
Bitcoin at $77,033 is the odd one out here and it is not because it has weak structure, but because the factor driving it is different than the other three. There is no geopolitics here like oil, no shortage of physical resources like silver, and no sovereign story like gold. It is more of a technical scenario in its current setup.
The $79,456 mark is where sellers from the early 2026 breakout regain control of the trend. That level was touched and rejected on the last leg up. This makes it the first rejection. Fibonacci extensions of the current swing high ($77,884.97) and swing low ($75,673.60) target the 127.2% extension at $78,486 and the 161.8% extension at $79,251 forming a cluster that squeezes up tight against $79,456, forming about a 200-point ceiling.
Momentum on the 1-hour timeframe is favorable for the bulls but still remains extended. RSI-7 (74.96) is technically overbought. RSI-14 (65.77) and RSI-21 (59.78) have medium-term momentum catching up to short-term momentum but are not yet quite there. The MACD histogram at 137.45 with the line at 207.83 and the signal at 70.37 confirms momentum building, not declining.
Hourly 200 SMA currently stands at $77,483 and the 200 EMA at $77,028 now both support the price; a break above the former at $77,483 is the first clean confirmation intraday of a sustained breakout. Daily pivot of $77,576.88 is the first clear test ahead. Below the current price, the 61.8% Fib retracement of $76,518 is almost precisely on top of the former accumulation box’s structural line between a “clean retest” and a breakdown.
Coming to the resistance part, $88k-$90k is the macro target if $79,456 is broken. This is 14-17% away from where the price currently trends now and would need a complete change of market nature.
Oil: The only asset with a specific, dateable catalyst
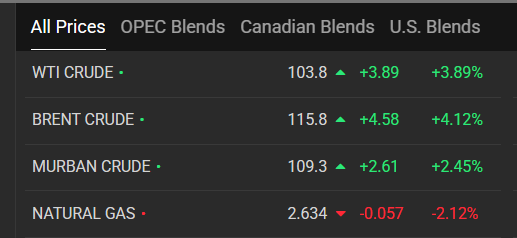
The major market movers are Brent Crude at $115.80 (4.12%) and WTI at $103.8 (3.89%). The U.S. is in the process of a long blockade of Iranian ports and the Strait of Hormuz, through which nearly one fifth of the world’s oil and liquefied natural gas supply usually transits, has been closed for several weeks.
The pricing mechanism is simple. Take supply out of a short-term inelastic market, and the price goes up. Brent had rallied down to $90 on April 17, after Israel and Lebanon’s ceasefire announcement. That discount is gone now, and it was this blockade that, based on one variable alone, has reversed the 28.7% surge from $90 to $115.80 over the last twelve days.
There is the most clear fundamental support for oil’s rally in this comparison. It also contains the most straightforward downside risk: the deal and the reopening of the strait. Until it does, the bid remains in place.
Gold and silver: Structural, physical, institutional
The exact mechanism has been mapped out by Andrew Maguire, strategic advisor at Kinesis Money. For gold, Maguire focuses on a physical delivery squeeze rather than a sentiment-based rise in price:
“Following the March 23rd spike low around $4,100 a bottom driven 100% by strong underlying physical gold demand, we saw a powerful $700 rally. This move clearly shows how mechanical correlations are being exploited in the physical markets.”
Physical gold being bought and consumed in the prompt physical-settled exchanges had a tendency to make short momentum covering and repos of the leased gold occur at considerably higher prices. This is not retail buying on sentiment but institutional mechanics unfolding through the physical settlement channel.
Maguire addresses where mainstream analysis misses the point: “Mainstream media continues to labour under the misapprehension that gold is no longer a safe-haven hedge. They ignore the fact that it delivered instant liquidity precisely when it was needed most.”
For Andrew, the longer-term target remains $6500 gold, flowing from the structural path of central bank acquisition, SWF placement, and unwinding of pure shorts in the physically settled markets.
More severe for silver; its supply cannot keep up with demand and COMEX silver is being delivered at a premium over SGE spot price-cash settlements trading at an annualized 8% premium. Bank of America’s base case is $135/oz; its bull case is $309/oz. JP Morgan has $81/oz out and allegedly holds a substantial position of its own.
Maguire’s silver target is $155. Here is Maguire’s summary of the setup structure: “The multi-year structural deficit is not an anomaly; it is the defining feature of the market. Its resolution will come through price.”
Gold’s and silver’s run is not the explosive, event-driven rise we saw from oil, and the recovery will not be as quick, but it should be more sustainable. That demand and supply situation is not fixed with a diplomatic agreement.
The comparison that counts
Three assets with fundamental catalysts. One with a purely technical catalyst. The distinction is important.
The oil rally terminates if the Straits of Hormuz are reopened. Binary, event-driven. Significant upside if the blockade stays in place, significant downside once it’s resolved.
The gains in gold and silver continue for as long as the underlying physical supply-demand balance doesn’t turn. It doesn’t look like the Central Banks are selling. Structural silver deficits aren’t cured in a quarter. Therefore, structurally, the move by the precious metal is more durable than oil’s, as it’s not driven by just one single geopolitical variable.
The largest cryptocurrency, Bitcoin, rally requires just one thing to continue and that’s a daily close above $79,456. Cleanest defined risk-reward in this whole comparison. Downside is limited to $76,504. If $79,456 flips to support, the upside is $82k – $84k before the $88k-$90k zone comes into play.


