Bio Protocol (BIO) had one of its best days in months as it closed up 18.93 percent at $0.0402 and was trading at $304.76M in volume. This number sounds cleaner and the chart is much messier.
This has seen BIO break out of a 2-month accumulation base, which was between approx. $0.020 and $0.030, breaking clear of the horizontal level of $0.0308 where that consolidation saw range resistance. The price has walked straight into a zone of resistance, with the 200 day SMA, a multi-month trendline down and Fibonacci swing high within a $0.005 channel above today’s price action. What happens in this area will ultimately give an idea if today was the beginning of a true recovery or an overshoot into supply.
The base that built this move
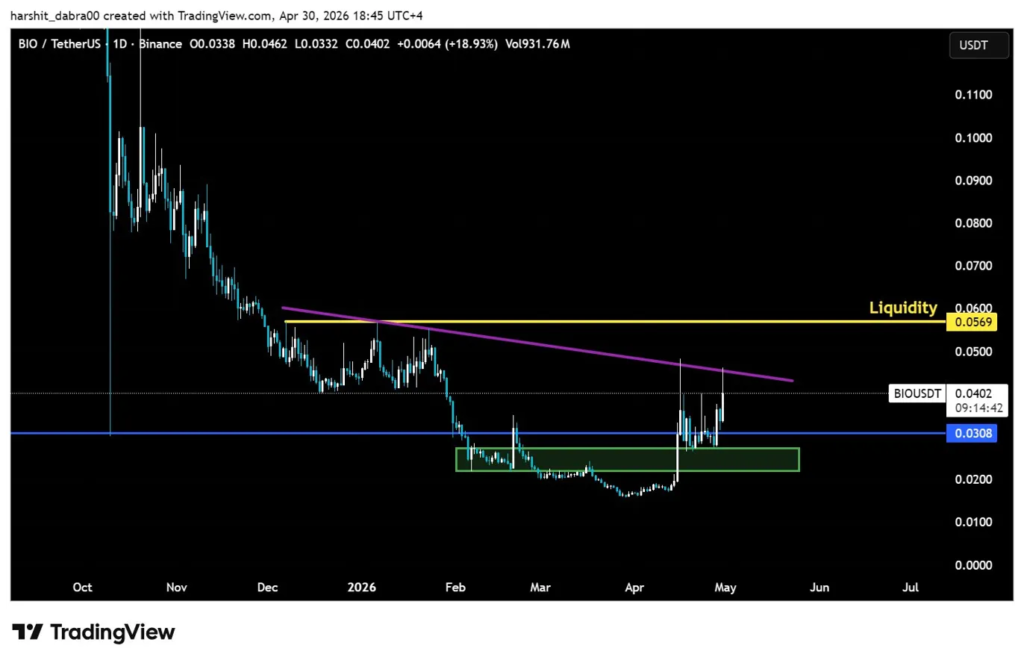
From about January to late April 2026, BIO established a range-bound consolidation on the daily chart. Price contained itself between $0.020 and $0.031, the upper limit being the horizontal support line colored blue at $0.0308. Volume dried up in this phase as the sellers exhausted themselves after the long downtrend that followed the top in October 2025.
The trend down was quite intense as BIO opened in October ’25 well over $0.11, and it would then reach as low as $0.016057, which is about an 85 percent move down. That accumulation area absorbed the impact; the green demand box is areas on the chart where buyers constantly defended the $0.020-$0.0276 area and made higher lows to set off today’s breaker.
As far as the moving averages are concerned, the 7-day SMA at $0.03156 is now trading above the 30 day SMA at $0.02438, a very bullish short- to medium-term convergence. The same thing indicates that the turn has already occurred and that it has happened internally to the base. Looking at the EMA stack reveals an identical reading: the 7-day EMA at $0.03186 and the 30 day EMA at $0.02658.
The resistance wall above
The 200-day SMA stands at $0.04374 and the price is currently $0.0402. An 8.8 percent differential the market has to overcome. The 200 daySMA can’t be termed as an arbitrary number but is the most watched moving average by institutions and systematic players. The digital asset has been below it for several months and crossing and holding above would definitely change the story.
A descending trendline connecting December 2025 highs also confirms the ceiling. That trendline has been active for approximately 5 months, linking each decreasing high in the sequence. As the trendline is now also nearing the $0.0437 to $0.0473 region, it is compressing resistance into an increasingly tighter band on a weekly basis. Compression has two effects: it brings the target breakout level closer on a weekly basis but may also sharpen the eventual rejection in the case that happens.
The recent Fibonacci swing high of the recent range is at $0.047283. Today’s candle printed a high of $0.0462, which is 0.1 percent off of the swing high, and retreated and stood at $0.0402 at the time of writing. The wicking above $0.046 in itself is not necessarily bullish or bearish; however, it indicates that the price tested supply at the swing high, failed to stay above it, and retreated. It failed to stay above the 23.6 percent Fibonacci retracement at $0.03991, and this is the level one wants to see consolidate above to remain bullish on the price of BIO.
The support stack
On the other hand, there is a series of levels to the downside: there’s the support at the 23.6 percent Fib of $0.03991 essentially the current price; then the 23.6 Fib retracement of the daily pivot of $0.034152; and the 50 percent Fib of $0.03167 at $0.03156 where the 7-day SMA is so a solid support level, likely at which point the buyers might step in for a deeper pullback without taking out the bullish structure of the asset.
The key point from the analysis is the strong and established support stack. A 10 percent or 15 percent pullback would leave the technical structure unchanged. This is significant because there are many fakeouts from accumulation bases, and just a one-candle move is not confirmation of a changing trend. For the structure to remain intact on a retest of the $0.0308 horizontal support mark, the price should not fall below it.