Zcash (ZEC) is up by 51.13 percent over the 30 days and 162.24 percent over the 60 days, and it currently represents one of the top performers across the crypto space during these periods. The asset is now trading close to $550 and commands a market cap of $9.16 billion, as well as a 24-hour volume of $975.95 million. That means it has a turnover ratio against the circulating supply of about 10.65 percent. The asset makes a place in thecoinheadlines top 5 privacy coins list as well.
What the 4H chart is actually showing
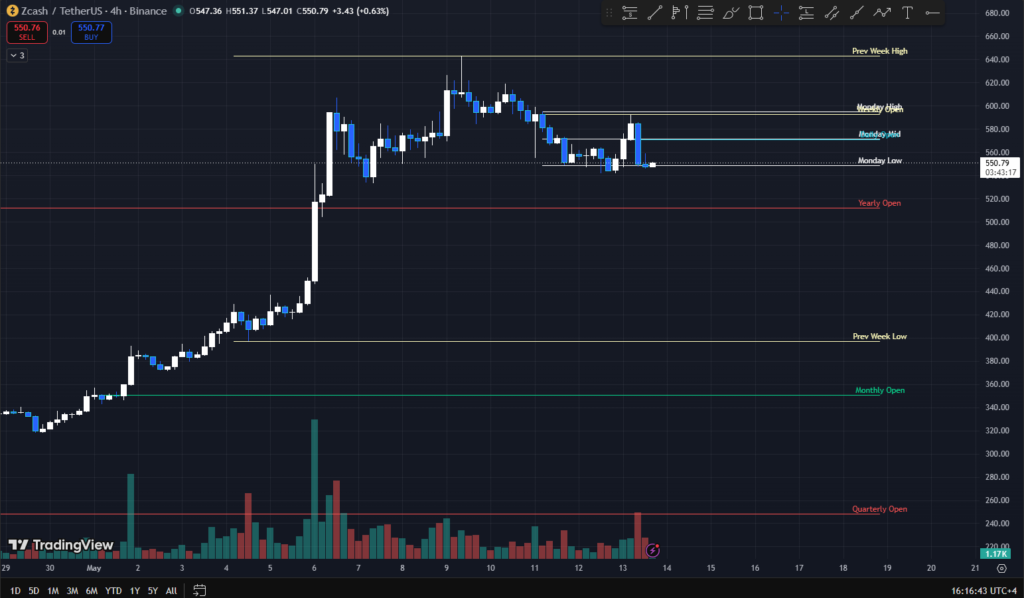
Over on the 4-hour chart, ZEC has made a local high near $655 on May 6 or around then. This is around the high from last week. Since this high price has condensed into a narrower range and is ranging between the support around the $547-551 region and resistance around the $598-600 cluster, which includes Monday’s high and the weekly open.
We have seen the Monday low of approximately $548 being tested and holding several candles across the two-day window, which is a good point to note. This level seems to be both a floor and also a magnet for price action during this phase of consolidation. The volume on the latest candle has a spike on the red side as of now, which can indicate sellers are trying to push and break this level rather than taking it out definitively.
The asset has experienced a spike to around $582 today during the early hours before a pullback to $549.58 by noon UTC. The move involved a rejection of $32 within a time frame of 8 hours. The asset tried climbing up to the resistance but failed to hold above it, and Monday’s low is the key region that ZEC is holding right now. $520 represents the important level as a yearly open, which remains untested. If the range doesn’t hold strong and experiences a breakdown, it will function as long-term structural support.
The monthly open at almost $360 and the quarterly open below $260 are far apart, but they offer some sense of air between the current price and past major opens. The move from $330 to $655 was completed in approximately 2 weeks in late April/early May. Tight consolidation after such a move usually ends with two outcomes: either accumulation before the move higher or a gradual retracement to the point of breakout.
The data behind the move
Compared to one year ago, ZEC is up 1,177.53 percent; this represents a year-over-year gain in value from where the price is today back to where it was in a 12-month period. Today’s price action is more meaningfully referenced from the high in November 2025 at $750. ZEC is currently down 26.7 percent from that recent high, trading at $549.58.
YTD performance is 4.69 percent. That number looks weak compared to the 30 and 60 days, meaning most of the move in the past three months of 2026 occurred in the last two months. It’s actually flat for the year until April.
The market cap of ZEC is $9.16B. The fully diluted market cap of ZEC is $11.54B. This is a very thin gap with 16.67M ZEC in circulation and a hard cap of 21M ZEC. This leaves about 4.33M ZEC to be mined in the future, which is a small amount relative to the current float.
With a 24-hour volume of $975.95M and a market cap of $9.16B, the turnover is around 0.1065. It is rather high for an investment strategy where one simply buys and holds. It also seems to suggest a strong element of speculation. This is what would be expected when one sees the large intraday swings from the trend of the 4-hour chart.
Privacy as a product, not a narrative
The 7-day figure displays quite a different trend to that of 30 days. At the time of writing, ZEC has declined 3.73 percent over the last 7 days, and thus the noisy part of the move has taken place. What we have now is a market grappling with the idea of whether the repricing was fundamental or not.
Vikrant Sharma, co-founder of Cake Labs, the creators of Cake Wallet, commented on his thoughts on the structural components and speculative components of the rally by ZEC, and he mentioned the following:
“Some of the rally is speculative, but the bigger story is renewed demand for financial privacy. Price moves come and go, but users are clearly looking for tools that let them transact without turning their financial lives into public metadata.”
This frames the question differently. Institutional demand has broadly been used as a driver of the rally. If that demand is coming from a desire for private, self-custodial infrastructure, as opposed to solely price exposure, then the demand profile seems different to a classic speculative pump. Someone wanting privacy features or a user interface is likely a different profile from a leveraged, momentum-chasing trader.