XRP is up 7.44 percent for the day at the time of writing. The asset is trading at $1.5335 that is a pickup from the previous two sessions, which saw roughly $2.36B notional traded. The gain brings the 7-day return to 8.85 percent and the 30-day return to 11.31 percent, among the clearer near-term recovery runs seen among the large caps so far, as a bullish reading appears on the surface, though the context surrounding it is more nuanced.
What the trendline break actually means
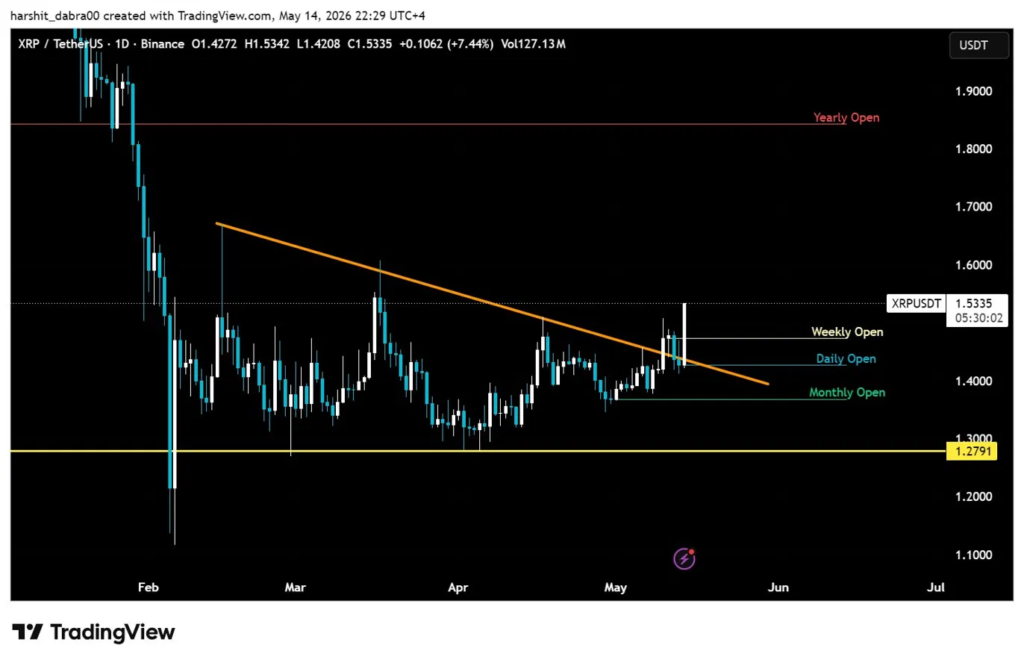
The orange descending trendline on the daily chart dates all the way back to late January, connecting a series of lower highs starting around $1.70 in early February, then to $1.50 in late April and then the first few days of May. Candle of today is through that structure cleanly, not a wick, not a test, but with a candle body through a structure that has rejected price multiple times, a minimum of 4 times on a time frame that dates over three months.
And it is relevant for only one thing; breaks of trendlines like this tend to change the nature of the tape and not just the price action. These multiple rejections have conditioned the short-term seller to fade rallies back to this line. An undisputed break has reversed the order; what was resistance above now has become support.
The split actually came near $1.50, not where bulls could start cheering. XRP currently finds itself above the weekly open (~$1.48), daily open (~$1.46), and monthly open (~$1.40). Every open currently finds itself below the price at hand, meaning that XRP is objectively stretched from any of these nearby time-frame references. This should remain a constructively positioned situation until we see a retreat.
The gap between $1.53 and $1.85
The year-to-date open is about 1.85. It alone does a better job of explaining the -19.15 percent YTD return than any other item on the sheet.
XRP started 2026 at the previous cycle highs and hasn’t been above them all year, apart from now, as today is giving up some ground but is still around 20 percent below where it started this year. All rallies so far this year, even the mid-March pop that took it towards $1.55 to $1.60 didn’t get to the year open and then rolled over.
It is the almost identical 60-day return of 7.03 percent and 90-day return of 7.58 percent that gives away the game. XRP has been ranging. The monthly open around $1.40 held as the floor up until this week, and the bounce from that floor into a trendline break is structurally sound, but it is a bounce within the larger range, not out of it.
Volume context and what $1.2791 means
This $1.2791 yellow line in the chart is the macro floor that has not been tested ever since the flush occurred back in February, when we were met by a single-wick candle that ran XRP to around the $1.10 mark and immediately went into an aggressive retracement. Until the price falls below that macro floor that was created back in February, higher lows are technically still in structure.
Volume is already up to $2.90B for the past 24 hours, which is a 26.16 percent move higher compared to yesterday. An increase in volume on an attempted breakout is generally given more significance than the price itself. Volume was already up to $3.05B on Saturday as price pushed from $1.42 to near $1.47 and it was obvious this move leading up to today has been a building move for days rather than an anomaly for one session.
The Thursday to Monday period looks like a nice stair step: $1.39, $1.42, $1.42, $1.47, and $1.48. Today’s reach to $1.5335 is just a further step within what amounts to six straight sessions holding at and making gains. That sort of pattern generally creates interest for the short-term momentum traders, and there is its own positive feedback loop, at least for now.
Implications for positioning
Three near-term opens reside beneath the current price. Alone, this does not give us a reason to fade the move, but it does tell us that some level of optimism has already been factored in, and a test would have to be confirmed to add to that. A failure toward $1.44-$1.46, exactly where the trendline that has now been broken lands, is the region of importance for a test versus a fakeout. Bulls will want to see that region hold during the market dips or short-term retracements.
The next logical block of resistance is found in the former trendline rejection region from the beginning of April at around $1.55, and the March highs around $1.55 – $1.60. If the market can establish a clear move higher over $1.60 then the discussion would likely center on whether the annual open of $1.85 becomes a possibility in the medium term.
A 1-year return of -40.56 percent compared to an ATH drawdown of 60.48 percent from $3.84 sets the macro context clearly: it has clawed back from the worst, but it’s a structural drawdown. This current move can be termed more of a recovery rather than a resurgence.