The derivatives market is indicating a very different situation than XRP’s spot price. Binance XRP futures have hit roughly $488.3 million in open interest, the most it has been in approximately two months. Meanwhile, the spot price of the asset is changing hands close to $1.36 which has decreased by 7.25 percent in the last week and 5.88 percent in the last month. It is this gap between an increase in OI and a drop in price that matters to consider.
What the open interest chart shows
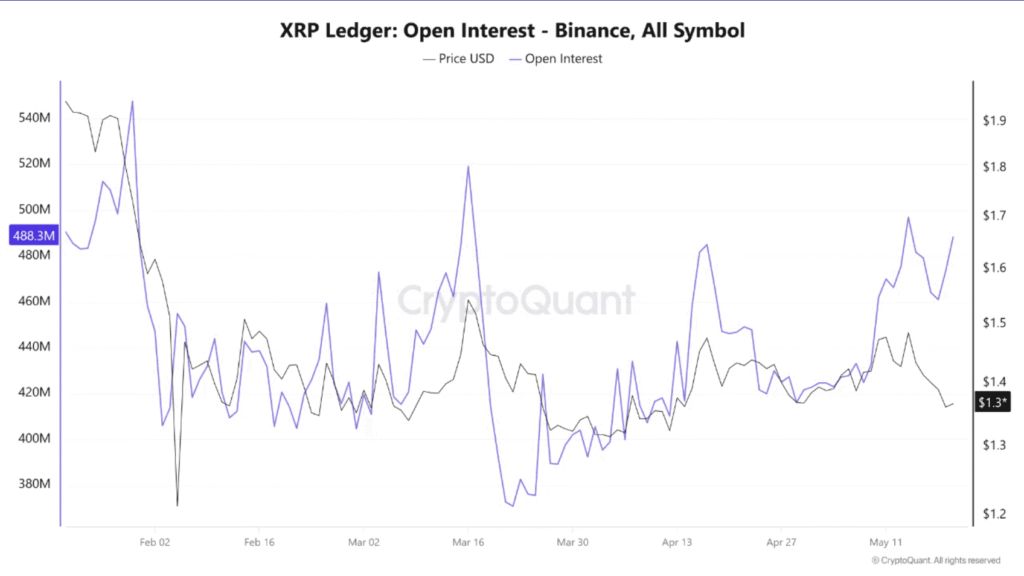
Using the data provided by CryptoQuant from Feb 2026 through May 15th, 2026, this shows us the positive correlation between price and OI well. In the beginning of Feb, we saw high values in both OI ($540 million) and Price (~$1.90) before we saw a price and OI crash into the latter part of Feb and all of March. Both lines closely followed each other throughout the descent, which should occur: a price crash leads to liquidations of longs, which leads to an OI crash.
So what happened in May was that divergence. Open interest has had a definite rally all through the first half of may pushing back towards $488.3 million, nearly $500 million, the highest it’s been since that mid march pump. The price hasn’t agreed, however, as XRP briefly touched about $1.50 before sliding back to where it is now, around $1.36. Open interest remains elevated, even as price has dropped, so this suggests no mass closure of longs when price tanked; rather, they just piled in more leverage and the price dipped and positions were held open.
What elevated OI without price confirmation means
Open interest is not inherently directional-it represents a total amount of outstanding money on contract (both long and short combined). A bullish trend in OI simply suggests that more new money is flowing into derivatives, not what side of the contract that new capital is playing on.
The persistent nature of OI is the applicable signal. That OI is around 500M for the middle part of May, pulls back slightly toward the $1.36 range, and then has maintained around $488.3 million, suggesting that many who entered positions during the May bull market are still not liquidating positions, which is unusual.
Generally, upon a retracement of the price following a rapid OI spike, an unwinding of the positions will take place (either by stop-out or by willing deleveraging). However, with OI sitting at a near two-month high with the price being approx. 7-9 percent off its mid-May peak, the implication here is that those positions are still in effect and they are not off the board.
And that poses another risk; significant directional moves in either direction will be much more important when there are a significant number of open leveraged positions. A move back toward and under $1.30 could trigger long liquidations and add momentum to a downswing. Conversely, if the pair moves back up to between $1.42 and $1.45, the 61.8 & 50 percent Fib retracement of the recent swing-short position will come under pressure.
The broader context
The market cap of XRP is $83.96 billion with a fully diluted valuation of $135.79 billion. This difference, the reason for which is the 38.16 billion XRP that is not circulating out of a maximum of 100 billion, is a known structural element that has had relevance for institutions examining entry points.
With 24h spot volume at $1.75 billion and 7d volume at $26.51 billion, XRP clearly continues to be among the most liquid assets in this space. Its liquidity matters given the OI reading of $488.3 million relative to $1.75 billion spot volume over 24 hours is a reasonable ratio; effectively, the derivative exposure is at roughly 28 percent of a single day’s spot turnover, which is pretty significant but not high enough for massive cascaded effects following an explosive move in spot prices.
On the technical side, the data supports everything about the discussed metrics. The RSI14 is sitting at 42.31, and the RSI7 at 34.4; momentum is slow, and the short-term reading is heading towards oversold.
Both SMA7 and SMA30 sit at $1.41, both below the SMA200, which is at $1.70. Clearly a technical downtrend exists over the main moving average timeframes. The pivot for the past session sits at $1.36, which is exactly where the price is currently testing the $1.36 level of support.