Solana has broken a major resistance level on the 4-hour chart after about three months. Although it looks as if Solana has started a new bull rally, the higher time frame charts show that even this breakout is part of the consolidation.
Solana tips over a 3-month downtrend line
Solana breached a descending trendline after 3 months when it spiked above $88. The coin has been following this downtrend since February 2026, as it was met with a lot of selling pressure at every single high.
Following the February 2026 date, heavy selling pressure has pushed the coin to reject any attempt at upward movement at each lower high point, as shown in the chart below, causing the coin to trade within a descending channel for an extended period of time.

But this recent breakout from below the declining resistance could mean that the sellers are finally losing their grip on price action. From a technical standpoint, when a descending trend line breaks, it means that sellers are losing their grip on price action.
Buying pressure pushes lows higher
For further clarification, when we observe the lows of the chart above, we can see that buyers are getting stronger. From February to April, all the lows were close to the $77 support level, which means buyers repeatedly defended that zone whenever the price dropped. This created a reliable support base where demand consistently absorbed selling pressure.
However, once April arrived, buyers started stepping in earlier, before the price could even revisit the $77 level. As such, this pattern shows that buyers are becoming more aggressive and increasingly confident in defending higher price zones.
Is SOL showing early signs of a market transition?
Although there is not sufficient bullish momentum to drive highs higher, there is enough buying pressure to make higher lows. In technical analysis, a higher low formation serves as one of the first indicators that the market is transitioning from bearish to bullish.
This is because buyers do not wait for substantial declines before entering into trades but instead start buying at an earlier stage, causing lower lows.
Over time, this tightening structure can build pressure in the market, eventually leading to a breakout if buyers manage to overcome resistance. This is how many bullish rallies begin.
But Solana’s breakout should also be verified on higher time frames, as the short time frames have a lot of noise and jagged movements that are misleading.
SOL is not transitioning but consolidating
On a weekly time frame, Solana does not seem to have done enough to show a major movement. It is still consolidating without losing the support level at $81. As such, SOL breaching the 3-month downtrend line is not necessarily something highly commendable on its own.
In strong trend reversals, higher time frames usually show clear signs of momentum expansion, such as strong bullish candles, increasing volume, and the reclaiming of major resistance zones. So far, Solana has mainly shown stabilization rather than aggressive upside continuation.

Nevertheless, the current SOL structure is suggesting the formation of equilibrium in the market after months of downward pressure. Maintaining the level of support at $81 is key to show that buying pressure is still defending the range.
However, until SOL begins printing higher highs on the weekly chart and breaks above larger resistance regions, the recent breakout could still be interpreted as a temporary relief move within a wider consolidation phase rather than the beginning of a full bullish reversal.
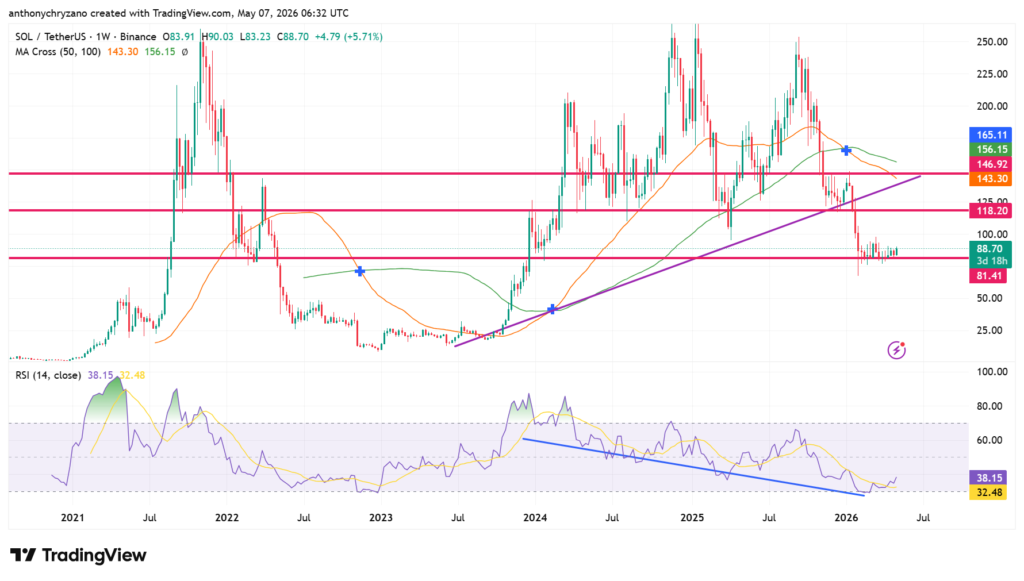
Although Solana is consolidating on the weekly chart, something positive is happening on the charts. As shown in the chart above, the relative strength index indicator measures whether the price of the token is undervalued or overvalued and has abandoned its trend of making lower lows and lower highs.
The RSI line has once again started to rise upwards. This shows that although the price is consolidating on the weekly chart, there is some momentum building behind the scenes.
This level is critical from both psychological and technical perspectives since it has been used to mark the strength of rejection in earlier stages of this downtrend. Thus, the ability of prices to exceed $120 will mean that bulls have taken control over this trend and started working towards turning its dynamics.
Besides, in case SOL continues trading above this level, supported by strong weekly closing and increased volumes, there is a high possibility that market players will return to this asset. In this way, the rise above $120 will not only demonstrate a spike higher but will also serve as a sign that a new growth period has started.