Solana emerges above a major resistance level after 6 months as it now leads the active agent sender market by a wide margin. This on-chain activity has given Solana the edge over the other tokens.
Solana has broken above the 100-day moving average after 6 months. Since October 2025, the SOL prices have been restricted below this major resistance. There were times when the bulls pushed the prices high and SOL tested the resistance level.
Although there were many occasions of SOL testing at this level, only a handful of events were reported of it actually breaking and going past these levels. Even in those instances when the SOL prices did not stand a chance of sustaining the ground, they recovered after the breakout.
Now that Solana has broken above the 100-day moving average, it is considered a big event in the crypto market. The 100-day moving average (MA) is important in technical analysis because it represents a mid-to-long-term view of market trend behavior, smoothing out short-term noise while still reacting faster than longer indicators like the 200-day MA.
Traders can use it as an important benchmark to help determine whether the underlying asset is in a bullish or bearish trend.
SOL breaks above the 100-day MA
The primary reason traders pay attention to the 100-day MA is that it usually serves as a dynamic support or resistance. In cases where the price moves above the 100-day MA, this indicates that the buyers have controlled the market for a more extended period of time, thus making a dip to this level attractive for buying.
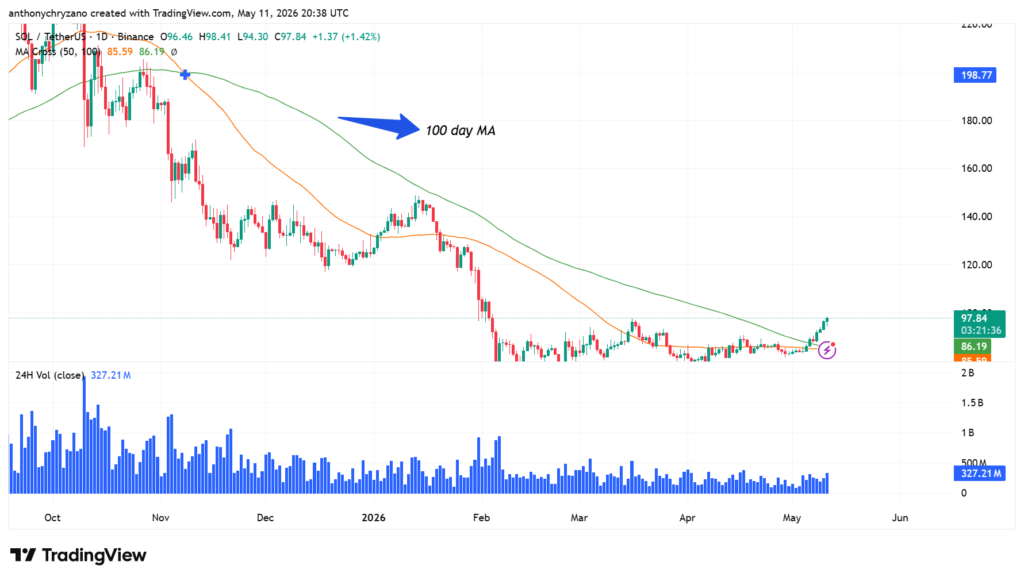
It can also be used as a measure of trend strength and market structure. Unlike the shorter moving averages such as the 20-day and 50-day, the 100-day average moves slowly due to its lag nature; hence, it is able to filter out any price fluctuations. This helps to confirm whether the trend was just an anomaly or not.
Importance of crossing the 100-day MA
Moreover, the 100-day MA is part of the confirmation signals system like the golden cross or death cross setup. The crossing of the shorter moving average above or below the 100-day MA indicates a possible change in momentum, which traders consider a reliable sign since it represents shifts in sentiment at various timescales.
It is also an area that institutional investors monitor since many large investments have medium-term time frames. The 100-day moving average can therefore be a self-reinforcing level, which may attract trading activity at the same level.
Overall, the 100-day moving average matters because it acts as a bridge between short-term noise and long-term trend direction, helping traders identify whether the market is structurally bullish, bearish, or transitioning between the two.
Solana has another go at the $100 level
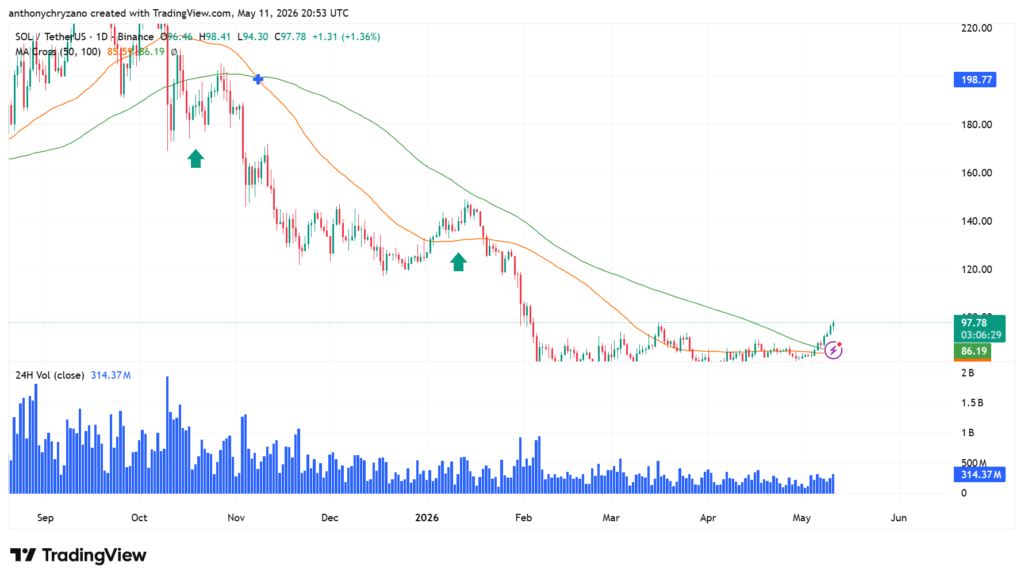
As shown in the above chart, Solana is once again approaching the $100 resistance level, which is a psychological level. Unlike the times when SOL tested the $100 during its crash, now SOL has established a clean uptrend and is approaching this level with volume and strong conviction.
More on-chain activity takes place on Solana
When it states “over 104K active senders,” it means that more than 104,000 individual wallets are sending out transactions on Solana. In essence, this metric measures the actual activity that users engage in, not just passive ownership of the crypto tokens. The higher the number of active senders, the greater the degree to which people make use of the blockchain.
The statement “SOL holds more than 43% of tracked activity, overtaking Base and Polygon” implies that the Solana blockchain network enjoys a substantial portion of all blockchain activity compared to its competitors, Base and Polygon. In effect, Solana is not only an active player; it leads among major players.
Although SOL is reaching a triple-digit value, the overall macro trend is still bearish. This means that after hitting values above $100, Solana will once again crash below the triple-digit level.
Downtrend may continue as overbought conditions emerge
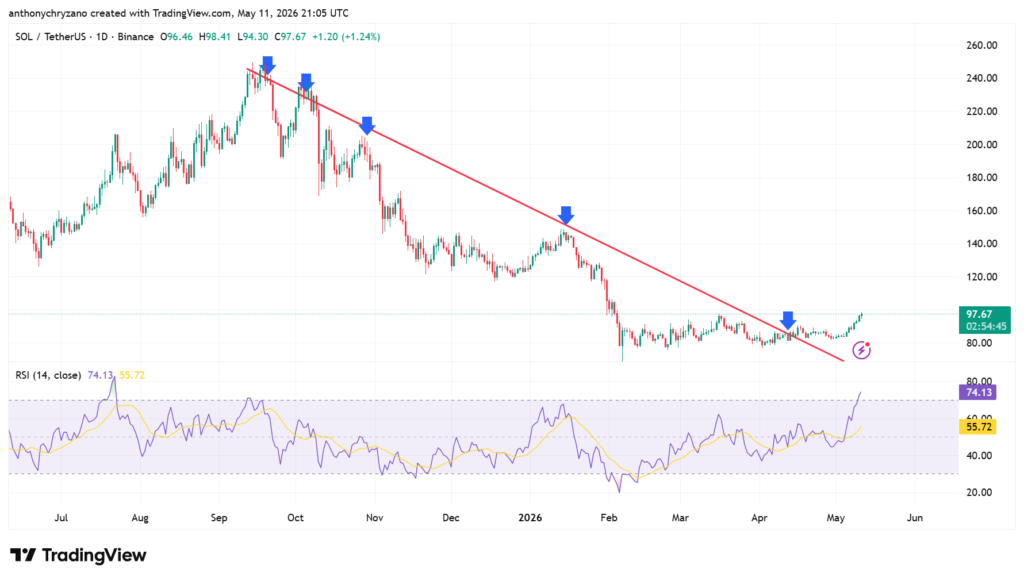
RSI is a technical indicator which measures the cost of the cryptocurrency and indicates when the token is overbought or oversold. Currently, the RSI indicator is indicating overbought.
Here, the overbought state of the RSI indicator shows that there was an unusually strong buying activity in the market which drove the price up. However, it is rare for any market to move indefinitely in one direction.
This is due to the fact that oversold conditions often result in actions such as booking profits. The previous short-term traders might have started selling off their positions for profit, while at the same time the new buyers are getting into a mode of hesitancy, which means there would be a decrease in buying and an increase in selling.
Correction doesn’t always indicate that there will be a prolonged downtrend from the point of view of price movement. Actually, it is just a sign that the market needs to get re-calibrated, as the price goes back to some extent after making a gain and can resume its positive movement if the overall trend is still intact.