ETH long-term holders are showing great conviction and are not selling their ETH holdings. They are tight-pocketed as Ethereum is forming a new uptrend, rising from February’s low of $1.8k. In addition to this, there are going to be some major developments coming this year.
Ethereum has been crashing since the beginning of 2026. In January of this year, the coin was priced at nearly $3.40; however, as the days progressed, the coin could not hold its ground at this level, and there was a free fall. By the first week of February, the coin lost nearly 50 percent in just a few weeks.
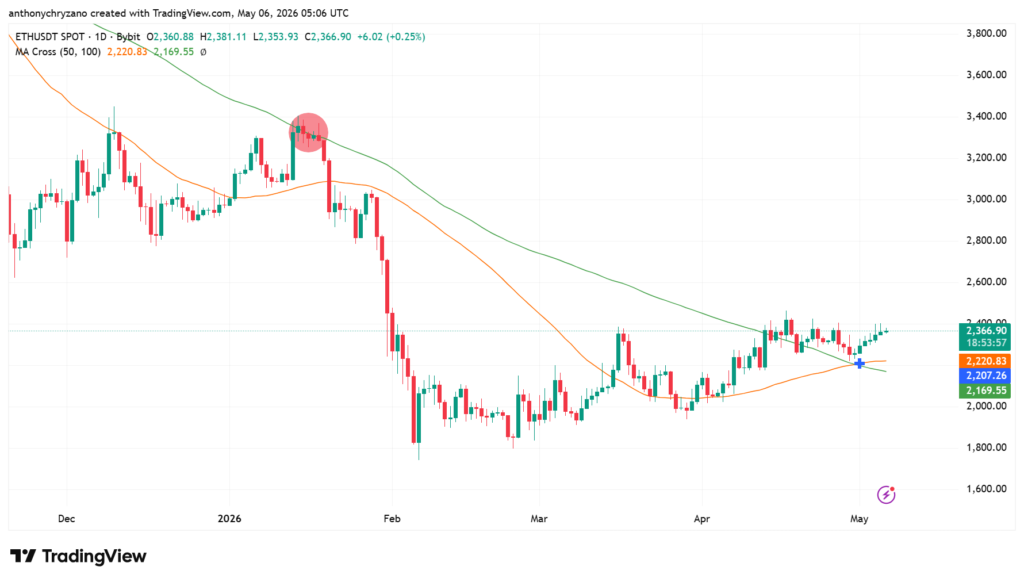
Once its Ethereum crashed hard, it was always trading under the 100-day moving average and was never able to even test this long-term trend indicator. However, things have changed now. After making a stunning recovery, the ETH price has once again risen above the 100-day MA, which is a positive sign. More importantly, the blue cross on the chart shows that ETH had a golden cross recently.
What is a golden cross?
A golden cross is a bullish technical signal that occurs when a short-term moving average crosses a long-term MA from below. Traders usually look for the intersection point of the 50-day MA and a long-term moving average such as the 200-day.
However, in ETH’s case, the long-term MA is not the 200-day but the 100-day MA. Nonetheless, it still qualifies as a golden cross. This crossover indicates that recent price momentum is strengthening relative to the broader trend, suggesting a potential shift from a downtrend to an uptrend.
Traders view it as a sign that buyers are gaining control and that upward momentum may continue. However, since it is based on past price data, it is considered a lagging indicator and often appears after a significant portion of the move has already taken place, meaning it should be used alongside other indicators for confirmation.
ETH will go through fundamental changes
ETH is not just technically improving, but even fundamentally it is going to go through a lot of developments. Crypto investor Ryan Sean Adams mentioned the new enhancements that the network would undergo this year.
The investor focused on how Ethereum’s block gas limit was increased within the last 4 years. He specified that the ETH block gas limit was 30 million years and then was increased to 60 million in 3 months. With the upcoming Glamsterdam upgrade, the block gas limit could cross 200 million by this year. And when that is put into context—from 30 million to 200 million in 12 months—the scaling is impressive, and it’s about 7 times better than what it was.
What is a block gas limit?
The block gas limit is the maximum amount of computational work (gas) that can be included in a single block on a blockchain like Ethereum. When the block gas limit increases, it enables the block to contain more transactions. Higher block gas limit = more transactions per block = higher transaction per second (TPS)
With the Glamsterdam upgrade, ETH is scheduled to close this year with 100 TPS. Although achieving 10,000 TPS by 2030 looks ridiculously high and hypothetical, based on the progression the Ethereum network has made thus far, it is not far out of reach, stated the investor.
ETH is about the breakout from the top
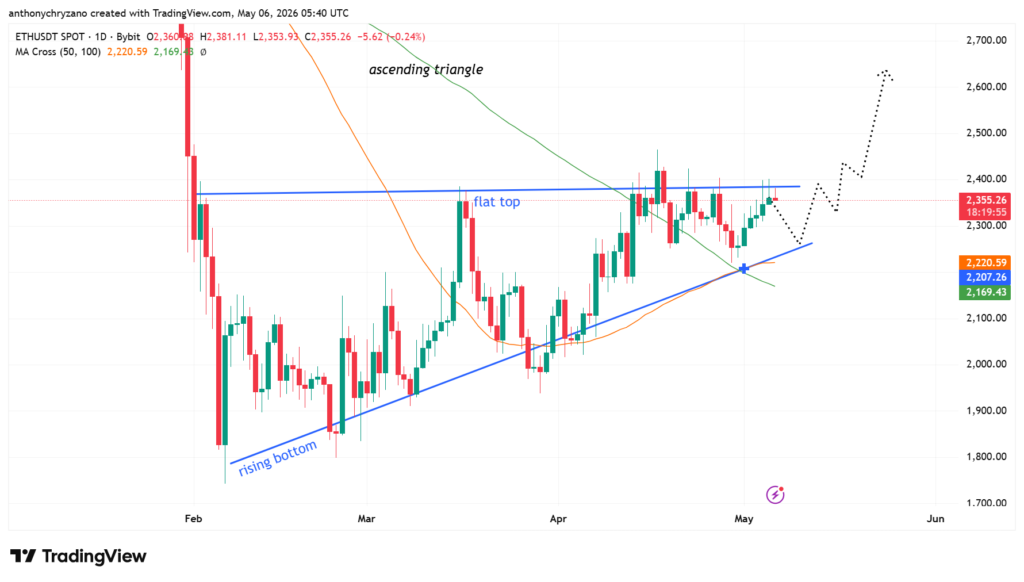
ETH is currently trading inside the ascending triangle, which has a flat top and a rising bottom. It is a bullish chart pattern where price moves within a tightening structure formed by a flat horizontal resistance level at the top and rising higher lows underneath.
Within this setup, sellers continually protect their resistance level with price getting rejected over time as the buyers start to get more assertive and enter the market earlier during the dips, making the lows go higher progressively. In effect, there will be an impression of growing demand and dwindling supply since the sellers will find it difficult to sell at the resistance each time.
Buyers usually see this kind of technical analysis as buying up the stock. This implies that the buyers are steadily accumulating shares from the sellers. As the triangle formation progresses, the market becomes less volatile and tight, creating pressure for the stock price to breakout. When the buyers break through resistance, a breakout usually occurs along with rising volumes.
Once the apex of the triangle is formed, a conventional breakout would see the ETH prices spike by the height of the wedge at its widest point. Given that the abovementioned statement is validated, ETH will easily cross above the $2,600 price level with ease.