Litecoin (LTC) is finally finding a reliable support zone after crashing since August 2025. Since LTC prices have been holding on stable grounds above $50 for more than two months, there is a high chance LTC is consolidating. This consolidation comes in the wake of unique wallets interacting with the Litecoin network hitting 1 million, with an impending upgrade called LiteForge.
Litecoin (LTC) loses 60% during the last 8 months
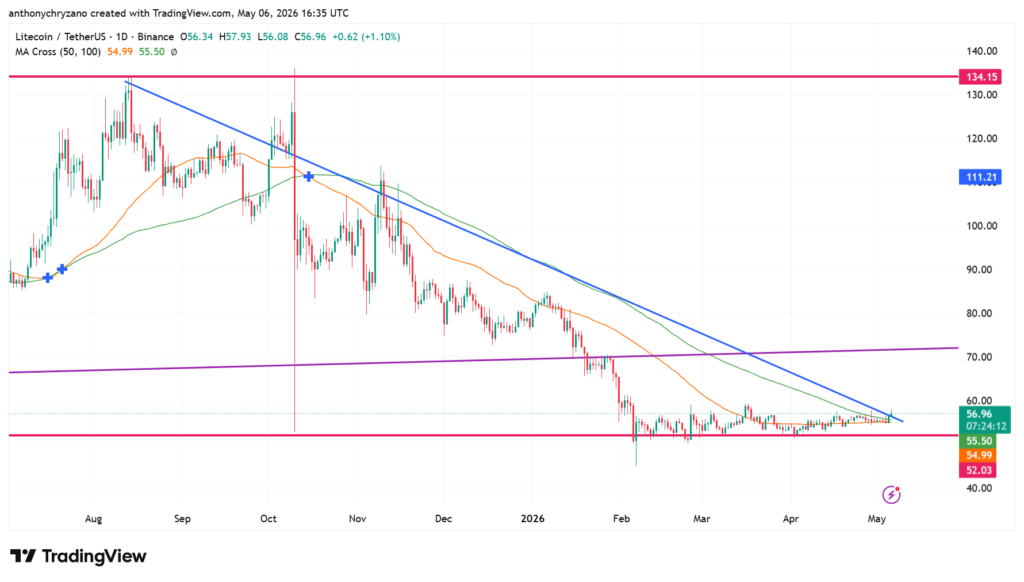
Since August 2025, there has been nothing impressive about Litecoin when it comes to how its price has behaved. After hitting values close to $135, the coin crashed diagonally, making lower highs and lower lows, and has currently managed to hold above the support level of $50. During this descent, Litecoin lost nearly 63 percent over the past 8 months.
Litecoin finds landing pad after huge crash
However, come February, the buyers mustered the strength to find a support level to land on. Having been supported at this level, Litecoin seems to have established a solid position. The repeated defense of this level suggests that selling momentum had weakened, while confidence among buyers was gradually returning.
As a result, Litecoin appears to have established a more stable base, shifting from a purely bearish structure into a phase of consolidation or early accumulation, where the market is attempting to build strength before its next directional move.
It’s more than just consolidation; it’s recovery
What looks like consolidation from a zoomed-out view is more than just LTC finding firm footing. As shown in the chart below, Litecoin has not just consolidated, but it has started to rally. The coin has breached the downtrend line that was restricting its movement.

The breach of this stronghold coincides with the prices crossing above the 50-day and 100-day moving averages. Litecoin crossing both moving averages and breaking the shackles of the downtrend—what does that mean?
In relation to Litecoin, such a situation means that the market may be moving out of the consolidation/accumulation period towards an upward trend. Furthermore, it is likely to bring more investors into play since most of them tend to consider a cross of the moving averages to be a signal of continuation.
In order to maintain its bullish stance, the price should remain above these averages and not fall below them, as this would mean that the price has had a false breakout. Moreover, the 50-day MA is about to converge on the 100-day MA from below, forming a possible golden cross.
In the case of a golden cross, the prices have the potential of spiking very high. The reason behind this assertion is that the golden cross usually indicates that the buyers are in control, and if the move is backed up by trading volume, then the prices might continue rising.
1 million unique addresses interact with Litecoin
This is a lagging indicator since it only gives an insight into what has happened in the past; therefore, there is no guarantee of future profits. In light of the above-mentioned signals, it should be noted that all these developments are happening amidst the imminent LiteForge upgrade.
The unique wallet interaction with the network is already at a million, implying that awareness of this upgrade is becoming prevalent. For the shift to sustain itself, it will be important for the prices to maintain themselves above the mentioned moving averages. This is because failure to do so might signal that it is only a false breakout.
Litecoin forms the bullish ascending triangle
The chart below shows LTC is currently trading inside an ascending triangle, which has a flat top and a rising bottom. An ascending triangle is a bullish formation consisting of a flat resistance line on top of the graph and a rising trendline as a support level.
As the pattern forms, sellers continue to hold their ground by rejecting prices at the resistance level, while buyers continuously push the price higher from each successive trough. The presence of higher lows in the pattern clearly indicates the gradual accumulation of buying power while sellers lose steam.

As the distance between resistance and support narrows further within an ascending triangle, the price becomes more squeezed, and hence volatility decreases. The tension that builds up as the price oscillates between resistance and support makes it inevitable for the bulls or bears to break out of the formation.
A successful breakout to the upside typically results in sharp movement of the price to new highs. But sometimes, even after breaking out of a triangle, the price moves in the opposite direction.