Chainlink is showing a massive bullish divergence signal on the chart after establishing its support level at the 50-day moving average. In addition to this, the token has also detached itself from the overshadowing rising wedge pattern, which confirms the bullish scenario.
LINK sellers let off the hook as bulls take over
Crypto analyst Michael van de Poppe spotted a big divergence on the 3-day chart as shown below. The relative strength index (RSI) indicator has been making higher lows while LINK has been making lower lows. This scenario indicates that although LINK continues to crash, the selling pressure is waning.
In particular, the divergence suggests that although bears are still managing to push the price lower, they are doing so with less momentum than before. As bearish momentum weakens, the likelihood of a trend reversal increases because it takes less buying pressure to move the price higher.
Bullish divergences are often viewed as early reversal signals rather than immediate buy signals. Traders typically wait for additional confirmation, such as a breakout above a key resistance level, a break of the downtrend line, or a move above an important moving average.
If those confirmations occur after the divergence forms, they can indicate that buyers have regained control, increasing the probability of a sustained rally. This is why analysts consider the current divergence on Chainlink’s 3-day chart a bullish development that could precede a stronger upward move in LINK’s price.
Chainlink escapes bearish rising wedge as bulls regain control
Another technical indication that LINK is bracing for a surge is that it has discontinued the rising wedge pattern. How? The rising wedge pattern is a bearish indication where the price keeps going higher with higher highs and higher lows while the range of motion narrows.
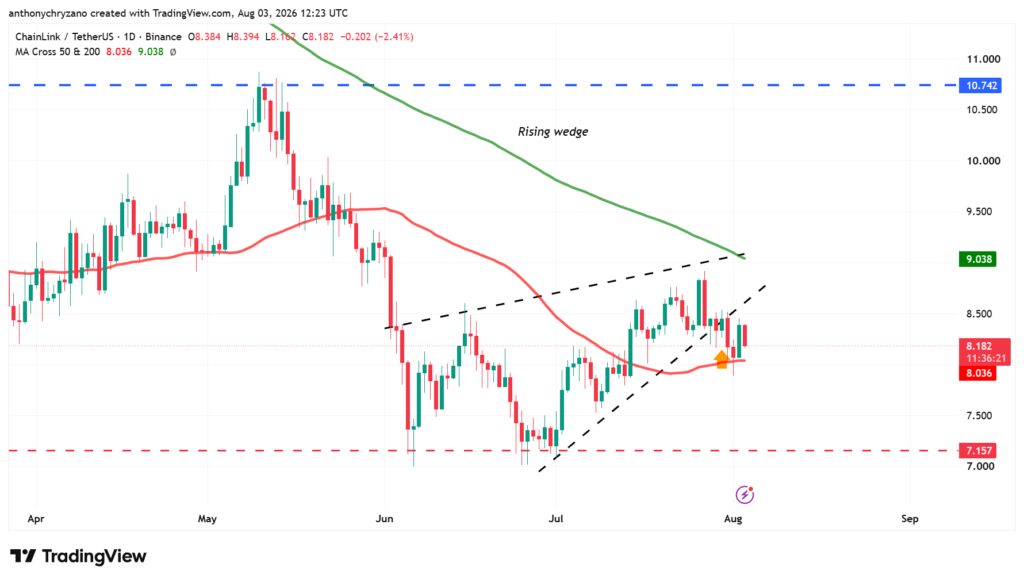
This shows that the buying momentum is fading and the selling is taking over. However, now that LINK has discontinued this pattern, the bearish thesis is now no longer valid. As LINK has established its grounds on the 50-day MA ($8.10), the next target would be the 200-day MA at $9.