Dogecoin is changing hands at $0.07277 and has seen a slight growth of 0.94 percent for the day after making a rebound from the level of $0.0719. This trending memecoin is once again testing the descending trendline that has capped every rally since July 5, while a support between $0.0700 and $0.0715 is continuing to hold.
The broader trend remains under pressure. DOGE lost the $0.090 level in mid-June, failed to reclaim $0.082 before the end of the month, and has spent the past three weeks trading inside a narrowing range between roughly $0.070 and $0.078. As the price continues to compress, traders are watching for a move that could decide the next short-term direction.
Every rebound has been challenged by this resistance
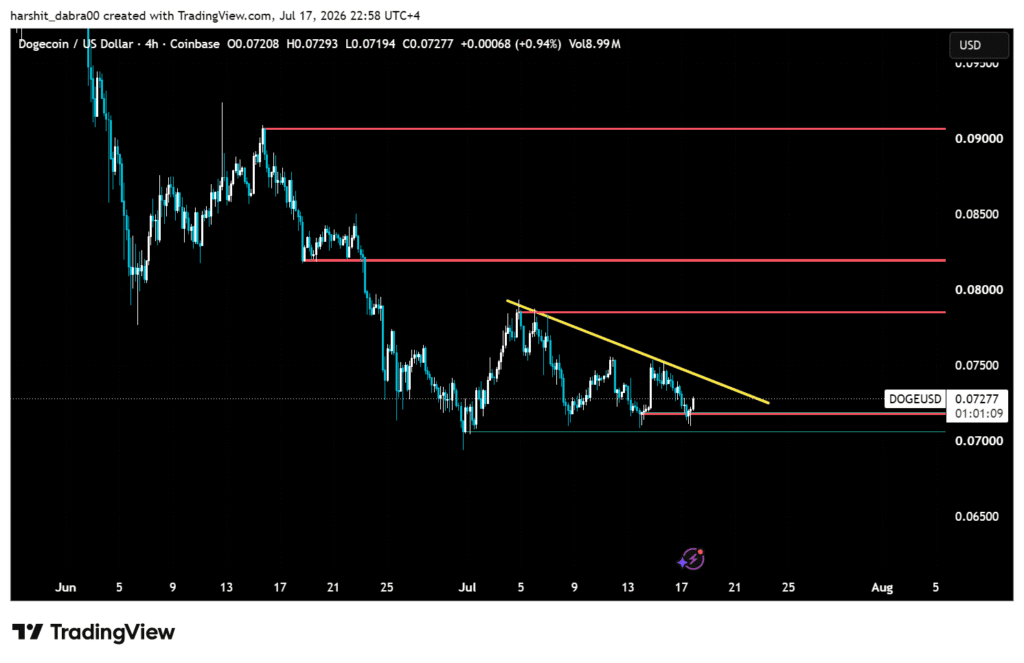
The descending trendline has rejected price three times in less than two weeks, with each test occurring at a lower level than the previous one. The latest attempt comes just above $0.0728, making it the most important resistance on the chart. A close above this trendline would be the first sign that the recent pattern is starting to change.
The negative aspect of this picture is the fact that support in the region of $0.0700 – $0.0715 was repeatedly defended (including the dip on Thursday), and it remains intact. The trading range can survive as long as buyers will protect it. If it’s broken, this memecoin may take a correction toward $0.0696, the last swing low.
As both the support and resistance areas have been tested on multiple occasions now, we see that neither sellers nor buyers have been able to push and get control of the market; instead, the market has been chopping and trading within a tightening range. Such price action usually ends in more volatile breakouts when one of the boundaries is eventually broken with volume, which then typically starts to grow on the breakout move.
Momentum is resting in the neutral zone
Momentum indicators suggest that selling pressure has slowed, but a bullish reversal has not yet been confirmed.
As prices hold at the low and with the RSI sitting below the neutral 50 for all 7, 14, and 21 period variations, the indicator signals that buyers are not pushing into the pair in any meaningful way. Furthermore, although the MACD and signal lines still rest in negative territory, the MACD histogram has shifted to a light positive territory, which would suggest bearish momentum is fading but this is not necessarily the onset of an uptrend.
The similar scenario is being depicted from the short-term MAs. The 7-day SMA and EMA are standing just above the current trading price of DOGE. On the other hand, the 30-day SMA is close to $0.0762, and the EMA is at $0.0772, and they both are aligning closely with the descending trendline marked in the above chart. Combining them, it is forming a resistance zone for this trending memecoin around $0.0735 and $0.0766
While indicators provide useful context, price action remains the main focus. A move above this resistance area would carry more weight than improving momentum readings alone, as it would show buyers are finally overcoming the selling pressure that has limited every rally this month.
The higher time frame is still pointing downside
The longer-term trend has not changed. The 200-day SMA near $0.100 and the 200-day EMA around $0.1069 remain well above the current price, showing that DOGE is still trading inside a broader downtrend despite stabilizing over the past few weeks.
Considering the importance of fib levels, they are highlighting the importance of the current area. The first resistance is standing at $0.0735, but the next crucial level is around $0.0766. This is the area where the 30-day moving average and the falling trendline are converging.
Even if DOGE breaks above this area, traders will likely look for follow-through before calling it a trend reversal. Holding above former resistance is often just as important as breaking it. Without that confirmation, the price could easily fall back into the same range that has contained trading since late June.
Considering the case for the downside, if the asset breaks below the zone of $0.07 and $0.0715, this could shift the attention towards the lower level, which is the swing low $0.0696. The bearish scenario will get the strength back if a break below the respective level happens. Following this, the risk of more downside will get increased.