Chainlink is changing hands at $8.50 at the time of writing. The asset is down 0.51 percent on the day after testing the level of $8.57 earlier. This tiny dip doesn’t even matter when it is placed alongside the larger movement that proceeded it. Just two days prior, the price was trading at $8.05. In that short period of time it has jumped across a barrier that has stopped prices on the decline since mid-June.
Additionally, that line has been resistance for this oracle leader since the price rallied up to it in June and in the first part of July. Every time the price was pulled up into resistance, sellers came in and pulled it down. Well, the price jumped right through it yesterday and has been riding the topside of it even with a small red candle.
The bounce has perfectly aligned with the timing
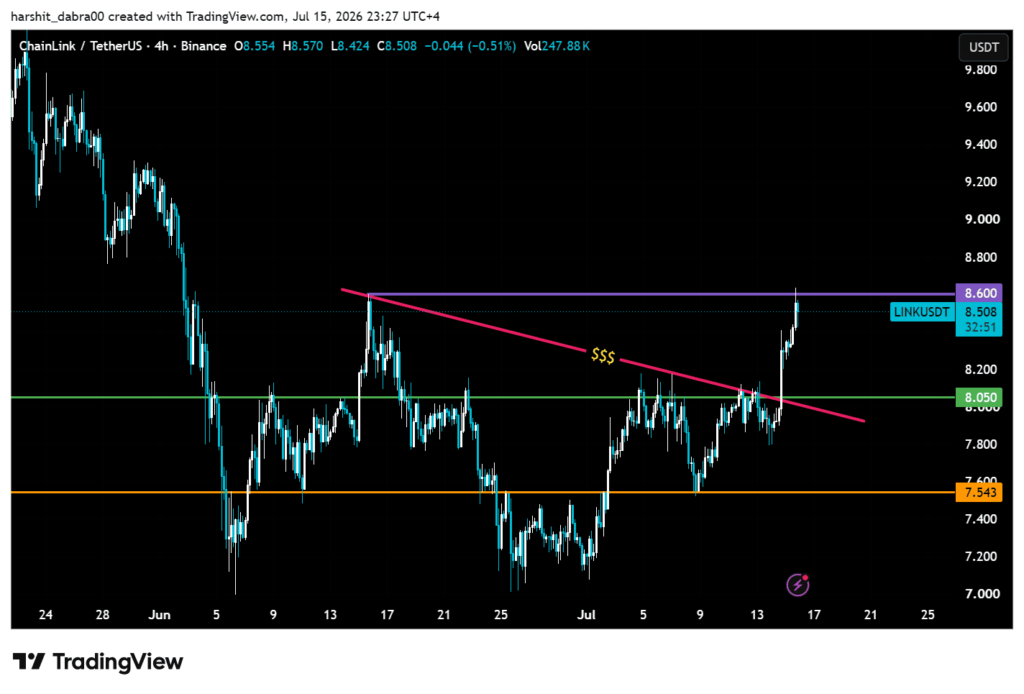
Most of July, $8.05 was working as a key level that was holding the price up. It was tested three times and failed three times. When this respective level broke, the line falling above it broke at the same time, as it was trading right near $8.05. When both break at once, it’s more significant when we compare it to a single break.
In the most ideal case, if the price breaks through the current price point, $8.60 is the next area to observe; the price briefly tested $8.57 and then pulled back, so it’s already approaching that point. Down below, the old $8.05 level becomes the first support the price needs to establish and in the worst case, if it falls once more, then $7.54 could be the level that the market participants can expect.
The volume is supporting Chainlink price action
Technical indications still stay positive on the latest bounce-back. Looking at momentum indicators, there are short-term indicators coming up toward overbought territory with RSI at 70.83 after the strong advance, but the longer-term RSIs at 60.59 and 54.99 suggest momentum is building without overheating.
The trading volume has crossed the monthly average by hitting $289.13 million in the last 24 hours, thus indicating the buying action was backed by the market as a whole. On top of that, the price is located above the daily pivot point of $8.19, so the advantage stands with the market bulls.
There is no convincing evidence for the long-term trend
$9.51 and $10.08 are the two values representing the longer-term averages and are still sitting above the trading price of Chainlink. In the time period of just two days, the asset has cleared the formed seven-week resistance. The important thing here is that it is still trading 11 percent below its longer-term average. In the time of a sharp bounce, being inside a market that has been falling for a while makes it a common scenario. It does not give any confirmation on the flipping of the bigger trend.
Following the case, if there is a closing above the level of $9.51, it could provide further confirmation on the shifting of the long-term trend. Until that happens, this move counts as a strong short-term rebound and has nothing to do with the bigger turnaround.
There are still a few common pullback levels at $7.80 and $7.61 formed from the move from the low of $7.02 to $8.57 based on the Fibonacci retracement. These mentioned levels are also sitting close to the chart’s existing support, close to $8.05 and $7.54, which is marking them as important levels to watch in case the asset goes into a correction. On the positive side, the next resistance is resting near $8.99 and is followed by $9.53. The respective level is in line closely with the long-term 200-day moving average. The longer-term recovery would get strength if LINK makes a move above that area.