Aave (AAVE) flips over the 21-day MA and the 50-day MA after deploying the V4 lending protocol on the Avalanche network. As AAVE approaches the triple-digit value ($100), it faces resistance.
AAVE flips 21-day and 50-day MAs
Crypto analyst Michael van de Poppe stated that AAVE has flipped the 21-day and the 50-day moving averages after almost a year. The 21-day moving average (21 MA) is widely used to measure the short-term trend and momentum. When the price trades above the 21 MA, it suggests that buyers are regaining control and that bullish momentum is strengthening.
The 50-day moving average (50 MA) reflects the medium-term trend and is one of the most closely watched technical indicators among traders and institutional investors. A move above the 50 MA often signals that the broader trend is shifting from bearish or sideways to bullish.
For AAVE, reclaiming both the 21-day and 50-day moving averages after nearly a year is particularly significant because these levels had acted as dynamic resistance throughout much of the downtrend. Multiple attempts to break above them were rejected, reinforcing bearish sentiment.
Now that AAVE has flipped both moving averages into support, it indicates that buying pressure has finally overwhelmed selling pressure. Holding above these levels could attract additional traders, improve market confidence, and pave the way for a sustained upward trend, especially if accompanied by rising trading volume and higher highs.
AAVE extends V4 lending protocol beyond Ethereum
AAVE breached this level after the V4 lending protocol was deployed on the Avalanche network. “The move marks Aave V4’s first deployment beyond Ethereum. Avalanche is a high-performance blockchain network designed to support digital finance, including decentralized finance, real-world asset tokenization, and institutional blockchain applications.”
AAVE’s rally get weaker as the price approaches $100
As shown in the chart below, AAVE is building a new rally, and it is approaching the $100 level. As it approaches this level, there will be significant resistance, as traders who bought the token at the local low of $60 will be waiting to take profits at this psychological resistance level.
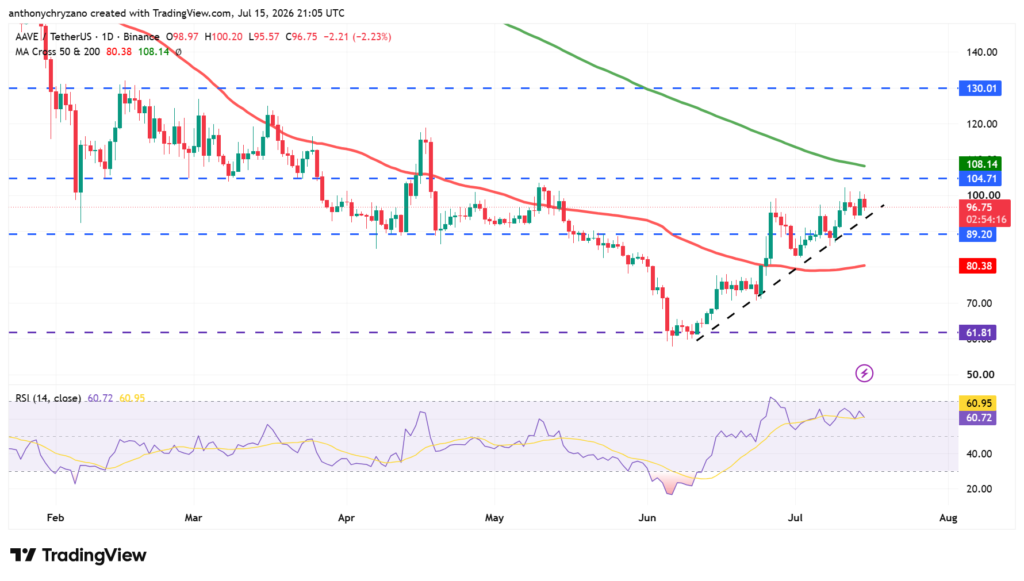
Despite the prices making higher highs, the relative strength index is making lower highs. When the price continues to make higher highs while the Relative Strength Index (RSI) forms lower highs, it creates what is known as a bearish divergence. This indicates that although the asset is still climbing, the momentum behind the rally is weakening. In other words, buyers are still pushing the price higher, but they are doing so with less strength than before. As such, AAVE may hit resistance at $100.