The narrative about Cardano on social media is that it is underperforming when compared to some altcoins. However, Cardano secured the second spot as the layer 1 with the highest validator count, with 2.9K validators now securing the chain. Despite this huge achievement, ADA price is still stuck at October 2023 levels.
ADA struggles to keep with other altcoins
Cardano, which is the 11th largest coin by market capitalization, according to CoinMarketCap, is being ill-spoken of on social media channels. According to Santiment, a crypto market intelligence and on-chain analytics platform, the narrative about ADA is that it is showing multi-year underperformance when compared to the other altcoins.
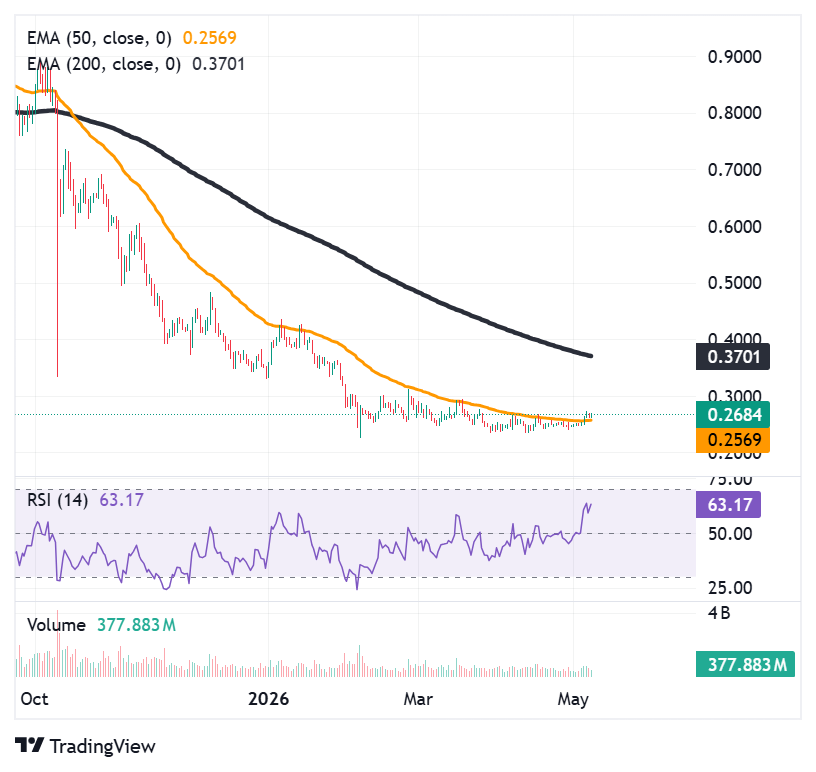
When looking at the recent price action of Cardano, the coin has emerged above the 50-day moving average after the prices were trapped under this psychological level for more than 6 months. Breaking above this level is a major win for Cardano. Why?
The 50-day moving average tends to be a barrier which separates a bull market from a bear market. Once the prices remain below the 50-day moving average for a long period of time, it is generally considered a sign of negative momentum as well as continuous selling pressure. Once the asset recovers above the 50-day moving average, it might reflect a positive shift in the market.
Cardano recover 50-day MA resistance level
In many cases, the 50-day MA may also play the role of dynamic resistance and support since both institutional and individual investors track it closely. This suggests that if a breakout from this indicator takes place, it will bring new buyers into play as the price has started to signal a change in its direction.
For Cardano, maintaining price action above this level could improve confidence in the market structure and potentially lead to a stronger recovery phase if momentum continues building. With the price emerging above the 50-day MA, some traders might be convinced that the coin could once again appreciate.
Cardano TVL drops by 80% to $150 million
The total value locked on Cardano has also drastically reduced. From a locked value of $880 million in December 2024, the TVL has drastically dropped to approximately $150 million as of now. This amounts to a drop of more than 80% within the last year and a half.
A decline in Total Value Locked (TVL) is one of the clearest signals of changing behavior inside a blockchain ecosystem, because it directly measures how much capital users are willing to keep actively deployed in on-chain applications rather than sitting idle or being moved elsewhere.
A sudden decline in TVL, for example, is a signal showing that the number of participants who have withdrawn from the DeFi ecosystem of Cardano has declined. The reason is that users tend to withdraw their liquidity from several DeFi applications, such as DeFi lending platforms, DEXs, and staking providers.
Funds could move to higher-yield chains
One of the most important interpretations is liquidity migration. Crypto capital is highly mobile. If yields, incentives, or trading opportunities appear more attractive in ecosystems like Ethereum or Solana, funds tend to move quickly. That migration reduces TVL and can leave behind thinner liquidity conditions in the original chain.
Another angle is reduced DeFi activity and engagement.The term “TVL” denotes “productive capital”, or capital that is currently working on earning income and enabling trade. The reduction indicates the fact that fewer people are engaging in such activities, which might indicate a decline in demand for the platform’s financial infrastructure. This trend usually results in shallower pools of traders, fewer revenues, and lower economic activity within protocols.

On the other hand, falling TVL levels might indicate increased risk aversion on the market. At times of high uncertainty, investors tend to withdraw their capital from smart contracts completely and park it either in stablecoins or offline wallets. Hence, the decreasing TVL metrics may be applicable to Cardano in particular or represent the industry-wide trend.
Ultimately, falling TVL doesn’t automatically mean the chain is failing, but it does indicate that less capital is actively trusting or engaging with the ecosystem at that moment. It is a signal of participation, not just price—showing whether the network’s DeFi layer is expanding, stagnating, or contracting in real time.
ADA struggles at October 2023 levels
With a price of $0.26, ADA is currently struggling to get going despite breaking above the 50-day moving average. Based on historical data, the last time ADA price was hovering at this level, the prices surged to $0.8 immediately.

So now the question is, will ADA replicate its 2023 price behavior? To find answers to this question, it is important to take a closer look at the price action of ADA. A key point that differentiates a traditional bear flag from the bear flag formation observed with Cardano is the fact that in the case of the former, consolidation takes place in an upper bound rising channel, while in the latter, there is evidence of weakness in terms of lower highs and lower lows.
With respect to the conventional bear flag formation, it becomes probable that the price action will trend opposite to the current downward trend because of the corrective process, which will be brought about by the accumulation of buy orders because of short covering. The primary determinant of such a formation would be the compression phase.
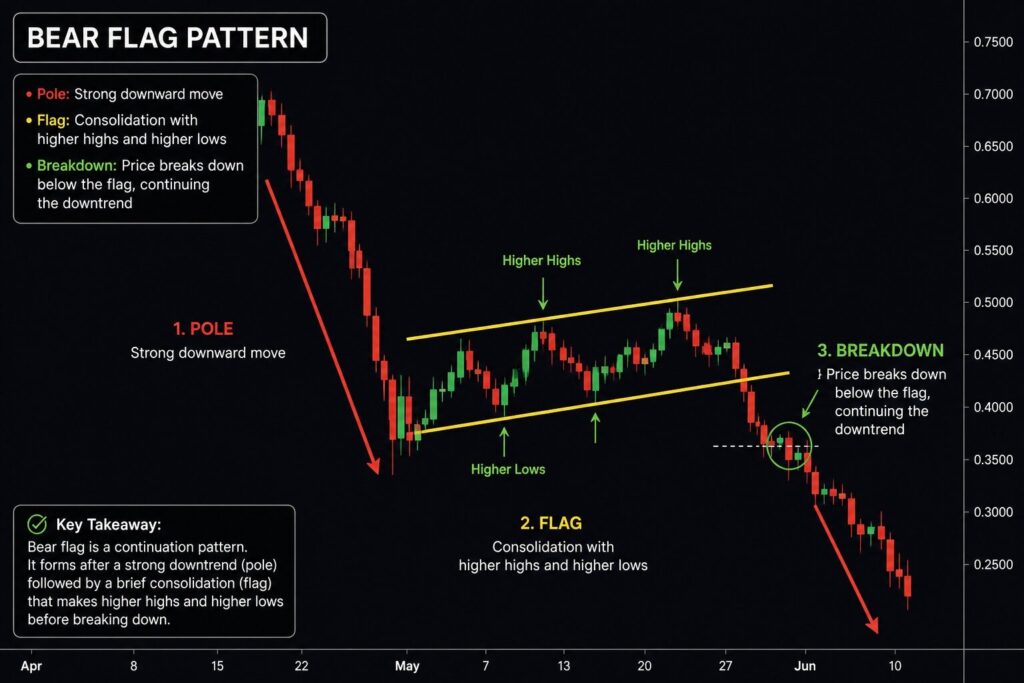
For ADA, this kind of pattern represents the loss of momentum with each new bounce attempt. The buyers are participating, but in reduced quantities with each attempt, indicating waning confidence. The bears sell early into each rally, ensuring that no reversal can form. This is not an accumulation pattern but a trend down.
It tends to be even more harmful compared to the bear flag formation since there is an imbalance in the chart pattern. There is no compression that accumulates energy for an explosive move, only an ongoing breakdown occurring simultaneously. The trend momentum is leaning towards the negative, and until ADA manages to reach another structure level, the trend bias will remain intact.