



BNB has crossed two major psychological resistance levels, the $650 level and the 50-day moving average, and is now challenging the flagship cryptocurrency, Bitcoin. BNB has gained ground against Bitcoin after being in a downward trend for more than 5 months; the BNB/Bitcoin pair has finally broken this trend.
BNB appreciates despite fear haunting the market
BNB, the native token of the world’s largest exchange, Binance, is making waves in the crypto arena. Despite the crypto markets’ mood being in a state of fear, BNB has been making big strides in the past. The Fear and Greed Index shows that the investors in the market are still in a conservative mood.
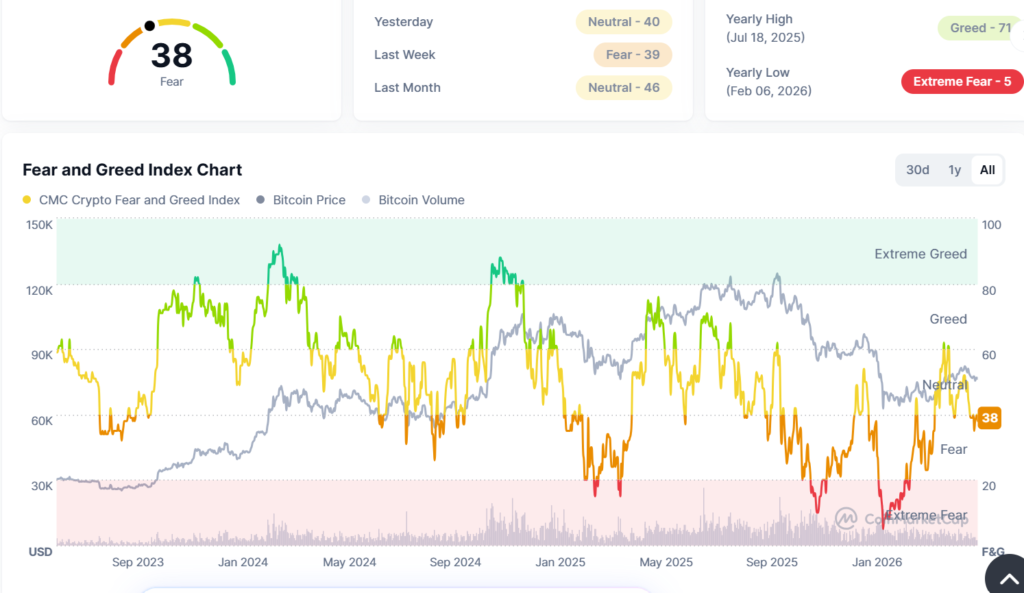
The fear component of the Crypto Fear and Greed Index measures how wary investors may be about their investments because they may be unsure or afraid about the direction of prices in the future. The fear index is likely to be triggered whenever there is falling volatility or prices.
As fears increase, traders become defensive. For some people, it is an incentive to sell assets to prevent themselves from losing money, while others do not buy since they think that prices will further fall.
BNB establishes bullish rally and sustains it for more than 2 months
Despite the market going into a risk-averse mode, the BNB token has been on the rise. As shown in the chart below, BNB has been on a rally since April, making higher lows and higher highs. When a rally lasts for two months, it generally means the asset has experienced a sustained period of upward price movement where buyers have remained in control for an extended time.
Rather than being a short-lived spike, a two-month rally suggests that market sentiment has stayed positive and that demand has consistently outweighed selling pressure.
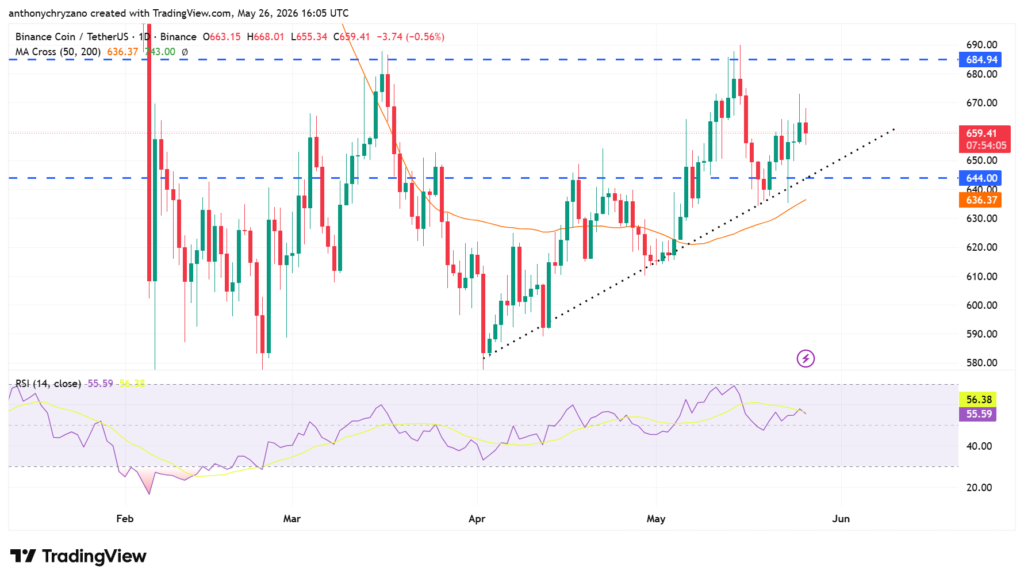
During this rally the token crossed two major resistance levels: the 50-day moving average and the $650 resistance level. The 50-day moving average (50-DMA) is significant because it is one of the most widely watched indicators for identifying the medium-term trend of an asset. It calculates the average closing price over the last 50 trading days, helping traders smooth out short-term price fluctuations and understand the broader direction of the market.
This indicator becomes quite important since a number of investors, institutions, and even automated trading systems look at it to identify whether the trend has changed or not. The reason why this level is significant for the investor is that when the price rises beyond this level, it is seen as strong bulls’ dominance. Conversely, when the price falls down to this level, it signals the change in momentum.
Traders showing confidence in BNB
The 50-day moving average also frequently acts as a dynamic support or resistance level. During an uptrend, prices may repeatedly bounce from the 50-day line, while in a downtrend, it can act as a barrier that prevents prices from moving higher. Because so many market participants watch this level, price reactions around it can become stronger and influence trading decisions.
The $650 resistance level is not created by technical formulas but by human behavior and market psychology. This level becomes important because many traders place buy orders, sell orders, stop losses, and profit targets around these price points.
For example, if a coin approaches a major level like $650 or $1,000, some investors may choose to take profits while others wait for a breakout confirmation before buying. This concentration of trading activity can create stronger price reactions.
When a psychological resistance level is broken, it can signal growing market confidence and attract additional buyers into the market. Traders often view such breakouts as signs of strengthening momentum, which can sometimes lead to increased volume and a continuation of the trend.
Bitcoin trips at the 50-day MA while BNB gets stronger
Now that BNB has crossed above these two major levels with momentum and volume, it has become a threat even to Bitcoin, which is still struggling to break above the 50-day moving average.
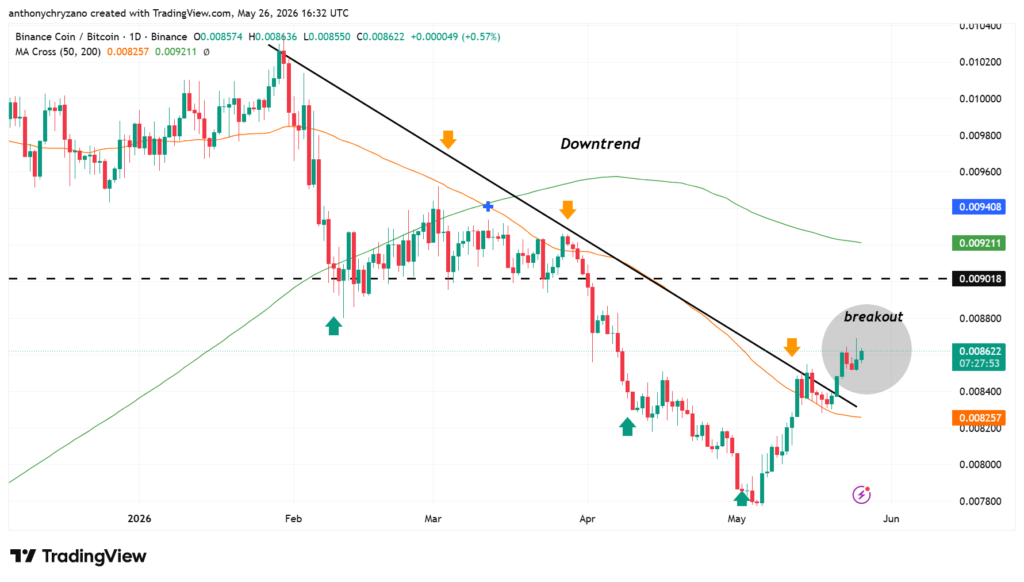
As shown in the chart above, the BNB/BTC pair has broken above the downtrend that lasted for more than 3 months. Since February, the BNB/BTC pair movement was restricted under this trendline, and it was making lower lows and lower highs.
The breakout after three months generally means that BNB is beginning to gain strength relative to Bitcoin. Since the BNB/BTC chart measures BNB’s performance against BTC rather than against the US dollar, a breakout suggests that BNB is outperforming Bitcoin after a prolonged period of weakness.
This could be an indication of changing market sentiment, where buyers are now showing preference for BNB over its trading partner. It might also imply that the downward pressure on the pair is losing steam while the upward force continues gaining momentum. When traders see this kind of breakout, it is usually a sign that a reversal could be imminent.