



Bitcoin is trading down 0.33 percent to $77,064 at the time of writing and today’s formed trading range is from $76,475 to $77,621. However, the more significant signal isn’t the price itself; it’s what the options market is saying about what’s coming up. Today, the Bitcoin Volmex Implied Volatility Index moved to 36.11, down from Monday and its lowest point in nine months, which is getting closer to 2023 levels.
The chart structure
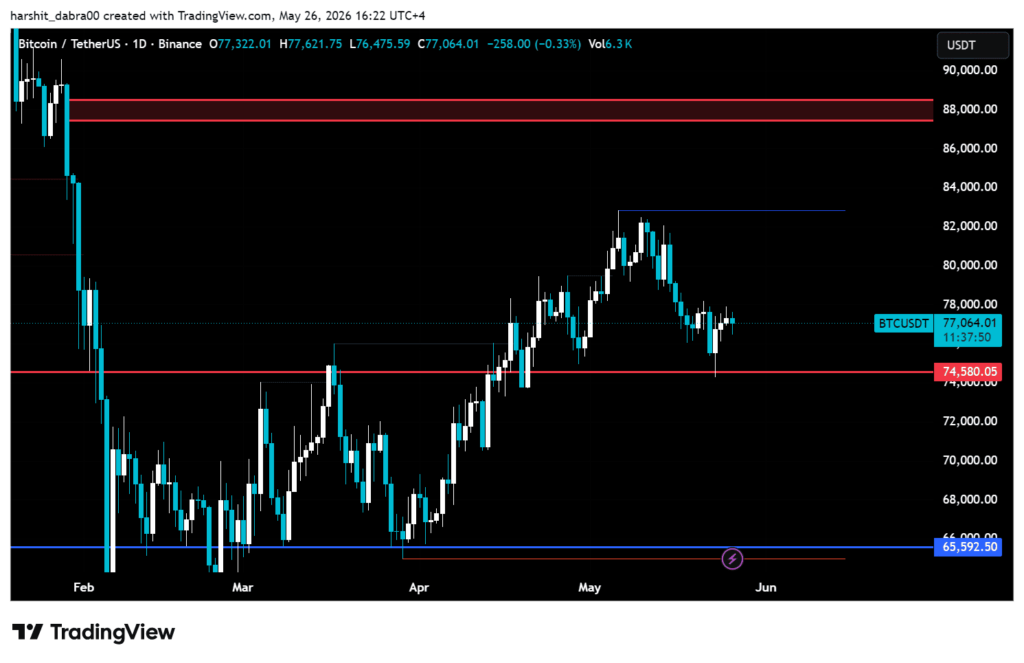
Bitcoin is trading sideways on the daily chart as it trades in a tight range that has held since the beginning of May. The levels are clear; the immediate support is $74,580 where the price bounced during the recent few trading sessions. This is a flipped support from the resistance levels established in April, which has had a significant structural role. The upper band of resistance is the previous swing high in the beginning of May at $83,000, followed by a second level of resistance in early February at $88,000 which rejected price when the high marked up.
At its current price of $77,064, Bitcoin is almost directly at the center of this $74,580-$83,000 trading range, trading only about 3.4 percent above support and 7.7 percent below the May high. In a market with nine-month lows in implied volatility, compression typically gives way to a bigger move to either side but not a stagnant move.
Anything below $74,580 the chart shows a lot more space down to the $65,592 level, which was macro support that held through Feb & Mar selling. Limited structure between those levels could fall quite fast if less than $74,580 daily level is taken.
What’s driving the pressure
Two distinct events are holding bitcoin back and it is by no means the same new event but a combination.
Geopolitical factor: U.S. strikes on missile-launching sites and mine-laying boats in southern Iran on Monday have complicated the things that were earlier stated by President Trump as ‘nicely proceeding’ nuclear talks. The Pentagon said the raids were “defensive,” yet these details are not usually well understood by the side of financial markets.
The growing Middle East tension has sent capital to the USD and the precious metals like gold (trading at $4,509), although the metal itself was down 1.33 percent over the day, while cryptos joined the equities in taking on board the risk-off environment.
The increasingly sensitive nature of bitcoin to these macro sentiment movements is also apparent in the price action seen throughout May. There has been a perfect correlation between news regarding a potential deal with Iran and the BTC price pushing towards $82k-$83k, with tensions re-igniting and pulling the price back towards the $74k-$75k range. The width of the range can also be attributed, in part, to these geopolitical influences.
The second is ETF flows. U.S. Spot Bitcoin ETFs, an obvious source of demand early in the quarter, saw net outflows following an extended period of institutional purchasing. The significance of this shift comes from the fact that ETF demand had become “structurally necessary to the Bitcoin support thesis.”
The higher Treasury yields and the specter of ongoing inflation present further headwinds. Market participants have been steadily pricing out the probability of Fed rate hikes in the near term, which makes non-yielding assets comparatively pricier to hold. The PCE index, the Fed’s favorite inflation measure, is on Thursday and may also move expectations in one direction or the other.
What the volatility collapse actually means
The Volmex 36.11 reading should get more attention. It measures expected 30-day volatility based on live crypto options prices. A reading that has compressed to a multi-year low could mean either we have officially entered a low-conviction, rangebound period with market participants willing to wait or it means we are sitting with an underpriced Volatility risk that does not yet incorporate a significant catalyst.
The PCE print on Thursday fell into that second category. An upside inflation surprise on PCE is the trigger that fuels more rate cut repricing, taking out bitcoin just as other risk assets were already in play. A print below forecasts do the inverse. Either, or the below levels for realized and implicit volatilities mean the options market is on sale and a cheaper way to buy some directional exposure than trying to jump into the cash side after the volatility has already taken off.