Binance’s 7-day cumulative net taker volume has turned negative for the first time since the end of March, at -$0.74B, with sentiment ratios at approximately -1 percent. Bitcoin currently sits near $76.7K still and that discrepancy between waning aggression and steady price movement remains the single most valuable insight this dataset provides at present.
What taker flow actually measures
Taker volume is the other side of the same coin of order flow and represents the aggressive behavior of futures traders. Buyers know that if they really want a price, they should lift it and bring the market up rather than letting the order book reach them. 7-day net cumulation smoothes out the daily volatility and gives a sense of the continuous directionality for participants in derivatives from centralized exchanges like Binance.
It’s not measuring if the aggregate number of contracts bought is larger than the aggregate number of contracts sold. What it’s measuring is willingness to pay the spread. That’s a critical difference because that separates momentum trading from passive trading.
Three distinct phases in 90 days
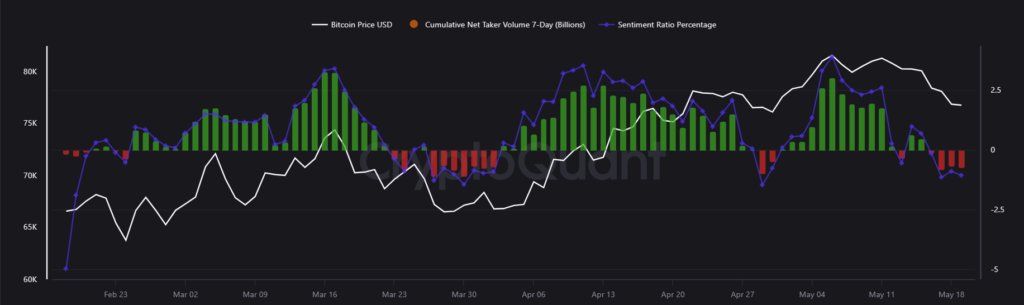
From late Feb to mid May there are 3 structurally distinct taker environments, and it is how those map to price action that makes the current reading interesting.
Phase one: It occurs from late February to mid-March. The size of the takers increased gradually, starting from nearly 0 and spiking to over $3.2B on March 16, when Bitcoin was testing the $80K level. Sentiment ratios peaked at around 4 percent for this period. The takers were buying like crazy and chasing the price up relentlessly in a confident manner. All of the bars are overwhelmingly green; not a single negative reading to disrupt this sequence. This was a prime taker-driven expansion where the price rises because they are willingly meeting the ask to get long.
Phase two (late March-early May): Post the March 16 highs, taker flow sold off drastically. The net volume remained negative in the March 23 to March 30 timeframe, as red bars consistently popped as price action nosedived from the high $70,000s to the mid-$60,000s. This was the first significant negative in the dataset, as it perfectly aligned with the precipitous price drop. Taker flow went positive again as price found a floor at ~$65,000, where it trended upwards through April; positive bars have popped up consistently as price has recovered back to the $73K to $76K range. The recovery trend looked identical to phase one, characterized by a constant trickle of positive taker flow, positive sentiment ratios, and price following aggressive money.
Phase 3 from the 4th of May: The Sentiment ratio peaked at around 3 percent on about the 4th of May as BTC reattempted to breach the $80k level again. However, the follow-through was faster this time. By the week of the 11th of May, bars began to become smaller. Net taker flow is -$0.74B with a sentiment ratio around -1 percent and BTC has fallen to the low $70k range. As one can tell from the difference, it is significantly unlike the persistent green structure shown from phase 1. This time around the frenzy of buying demand has culminated and faded within about 2 weeks.
The divergence that is significant
What’s important about the reading we just got is not necessarily the negative number; we’ve seen this multiple times with this dataset and it hasn’t hit tops. The distinction to make here is the location of the flow relative to the price; back at the end of March, flow was severely negative, but price was already far in drawdown and was accompanying the downward flow. Here the price is still sitting close to the range of mid-$70K, while net taker volume is already -$0.74B with sentiment ratios down at near -1 percent. It’s simply the drop in market aggression before it caught up to the price.
These current negative prints are still relatively small in relation to the March lows: small red bars, not long stretches of deep red bars seen in the $65k Bitcoin capitulation. Perspective is required. This is clearly not panic-driven deleveraging; what this appears to be is an orderliness in terms of a pullback in bullish conviction. Passive orders are enough to support the current price action and absorb sell-order flow; however, sustained positive taker flow typically precedes any large expansion phases. The presence of such flow at these price points implies that buyers willing to aggressively step up to the market and bid Bitcoin back up toward $80k simply do not exist within the order book at the present time.
What this means for near-term structure
Takers’ flow is showing the market is moving away from rapid growth and into a low-aggression environment. Price can still be high during low aggression levels, as there are passive levels still absorbing sell-offs from market makers and spot buyers. However, the odds of seeing continued higher directional moves sharply diminish once takers become negative overall. The 72k-74k region has been retested numerous times and it is a defensive level but not a basing region if buyers do not actively take their side.
A reversal to sustained net positive taker volume, especially if sentiment ratios rise back above 1-2 percent, would suggest momentum traders coming back into the market. The previous two iterations saw taker flow dictate the direction of prices. Until that structure reverses, the data is suggestive of sideways action or a slightly downward bias rather than a further expansion. The path of least resistance is sideways until more is shown in Binance’s order flow.