


Bitcoin simultaneously faces two distinct dynamics. Institutional demand, measured via inflows to U.S. Spot ETFs, is rebounding at the fastest rate since launch. Meanwhile, 2026 has also seen a negative structural on-chain demand, as recorded by apparent demand.
The ETF picture looks genuinely strong
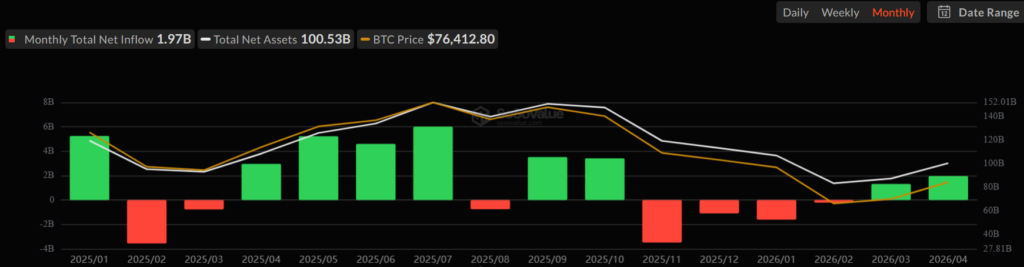
The U.S. Spot Bitcoin ETFs had their strongest month since inception in April, attracting $1.97 billion in net inflows based on data from SoSoValue. This significantly exceeds the $1.37B that was seen in March and comes after two consecutive months of net outflows that year, which erased the initial year-to-date gains. The gains that accumulated in March and April effectively balance the prior two months of outflows and have put the products up $1.47B net so far in 2026. Cumulative inflows since their launch in January 2024 are at over $58 billion.
This increase was predominantly fueled by BlackRock’s iShares Bitcoin Trust ETF. IBIT pulled in $2 billion of net inflows over April by itself, a higher number than the net flow of all ETFs in the month. The disparity is due to ongoing outflows from Grayscale’s GBTC, which lost nearly $280 million during the month. The disparity between the two products has been ongoing and has become structural. Since the approval of the spot ETF the outflow from the expensive GBTC has shifted into the more low-cost IBIT.
The Morgan Stanley Bitcoin Trust ETF had $194 million in inflows from April 8-30 with zero days of net outflows, an impressive track record after under a month of being live.
Total assets under management (AUM) in all U.S. spot Bitcoin ETFs recently hit $155 billion, the highest level since the beginning of February.
The on-chain data is telling a different side
Apparent demand (a 30-day sum) is -44,700 BTC. The metric is the difference between new issues and the change in over-1-year-old supply on a daily basis. A positive number indicates a new issue being absorbed by the market while, at the same time, dormant coins are entering circulation, a real sign of structural accumulation. A negative number indicated the opposite. New supply isn’t finding sufficient buying pressure to absorb it.
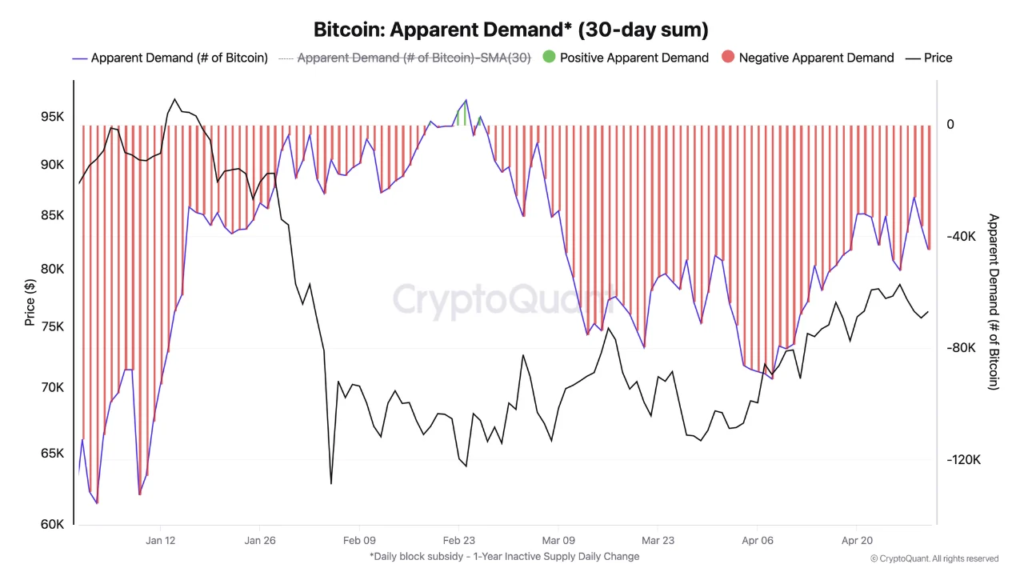
The visible demand has been negative at -44,700 BTC every month since the start of 2026. A minor green reading at the very end of February is worth questioning rather than appreciating. It was not fueled by increased accumulation and can be attributed instead to falling BTC supply due to drastically reduced mining resulting from extreme weather in the U.S. This reduced supply in circulation made the ratio look favorable for a short time. Underlying accumulation has not shifted, and those who read that as a demand rebound are trading noise.
April has seen a considerable but not massive leap. The lows on apparent demand were recorded in the beginning of April at -89,000 BTC; a -44,700 BTC reading is about a 50 percent jump from that point. The trend is in the correct direction.
Why the two signals diverge
How could ETF inflows of $1.97B and on-chain apparent demand of -44,700 BTC be true at the same time? They measure different factors.
The ETF inflows reflect the institutional money finding its way into the Bitcoin market via the fiat world. In the case of $2B flowing into IBIT, Coinbase Custody takes custody of the relevant Bitcoin in cold storage on behalf of the fund. A portion of the Bitcoin moves from the seller to the custodian and mostly stays put. From the perspective of the on-chain transaction, it becomes what is effectively dormant supply.
Apparent demand is quite different. Apparent Demand is the net interaction between new Bitcoin issuance and the bringing of idle supply into circulation again (that has been dormant for greater than one year). A positive apparent demand indicates a new coin being purchased simultaneously with the old supply being taken off the market. A negative, it does not. An important point is that Bitcoin within ETF custodianship simply does not move: it rests in custody. Supply that does not move is not demand.
In other words, ETF buys can remain robust while apparent demand can remain negative if the pace at which long-term holdings are being reactivated isn’t fast enough to overcome the rate of new issuance absorption. That appears to be the current state of play. $1.97 billion worth of ETF inflows in one month at $95,000 per BTC equates to about 20,700 net BTC buying from the ETF route in April. The 30 day net on apparent demand is still -44,700 BTC. The math indicates ETF buys are assisting but not enough to turn the structural part.
What history says about this setup
This can be shown using the long-term apparent demand chart. At the peak accumulation phases of Bitcoin, the 30 day sum has exceeded 500,000 BTC at multiple points, while during deep bear phases the value has reached -500,000 BTC and even lower. At -44,700BTC, the value is negative; however, historically, it is far from extreme. At the moment, it appears the current market is in a phase of soft contraction, rather than a structural breakdown.
History also suggests that periods of protracted apparent negative demand generally conclude with one of two outcomes. One is that apparent demand turns positive, with price continuing upward. Alternatively, a secondary drop in price leads to more profound capitulation and, ultimately, enough buying to turn the metric. The present picture does not give an indication of one being more probable than the other. What it signals is that resolution is forthcoming but not yet realized.
Since early February, the price of bitcoin has been up by around 30 percent; its best monthly performance was in April, with 12 percent. On the macro side, the market is looking positive. The demand is not enough since it’s shown only by apparent buying at -44,700 BTC to start a sustained, new upward leg. Markets seem to be on a floor and hoping that the data will catch up with the price.
The actual accumulation-based sustained move back into positive apparent demand will still be required as the absent confirmation.


