SUI is currently sitting at $1.09 on the daily timeframe, with a rise of 1.16 percent today, -9.45 percent for the week, and -25.84 percent year to date. The price action over the past few months (since October 2025) points out more structure-related metrics that need to be tracked.
The current price structure
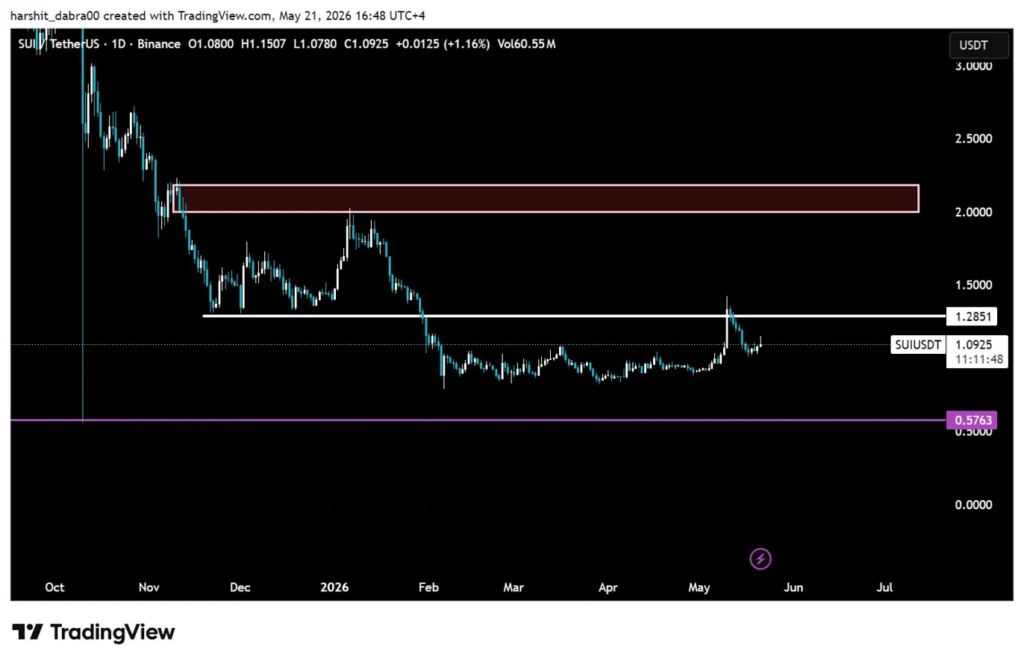
The daily chart of the SUI pair demonstrates that there has been downward pressure for nearly 8 months and a tentative recovery attempt. Following a peak just below $3 in October 2025, SUI dipped to roughly $0.85 in February 2026 and has been climbing tentatively back to the present $1.09 area. The most crucial level on the chart is $1.2851. SUI broke through the $1.2851 zone briefly in early May and the pair climbed as far as $1.4507 before being dramatically rejected; this zone is key, as prior to the breakdown at the end of February, it served as a consolidation range. In simple terms, old support becomes new resistance. As long as the price remains below $1.2851 the recovery structure on the chart is suspect.
Below where it’s currently trading at $0.5763 is the more significant, long-term structural floor, and it acts as the extreme downside reference if markets continue to take an unfavorable turn. On the other hand, the wider $2.00 to $2.15 supply zone still dictates the broader bearish structure. Price has been rejected off of this range multiple times in late 2025 / early 2026 to solidify that this zone is still well respected by sellers. Unless the price breaks convincingly through these areas, the overall downtrend still applies.
What the recovery actually looks like
It is from February through May 2026 that things get interesting. SUI bottomed out somewhere close to the $0.788 level around the start of February and bounced to a high around $1.42 at the beginning of May, which is about an 80 percent bounce. This sounds optimistic until we place this action into context. It bounced straight into the $1.2851 supply level and was exhausted.
The 30 day gain and 60 day gain of positive 15.24 percent and positive 18.09 percent show this recovery but hide the fact of rejection. The 7-day gain of negative 9.45 percent indicates exactly what happened after the price reached $1.4507, which is a sharp reversal back to present levels.
This is where volume context is key. Volume over 24h stands at $888.64M, whereas market cap is $4.37B. The volume over 7 days stands at $4.25B. The turnover ratio is around 0.20; this signifies the asset is traded relatively actively and in a liquid manner, but that big moves are formed easily.
The 79 percent ATH drawdown problem
The peak for SUI was an all-time high of $5.35 on January 06, 2025. The drawdown from the peak at $1.09 is 79.63 percent. The all-time low is $0.36, so the current price is about 3 times from the floor but less than 21 percent of the peak value.
This wording is important to how we frame the logic. Traders who bought into the “dip” from ATH highs are holding significant unrealized losses. SUI launched at $0.9745 in June 2023 and trades at $1.09 now so those who bought into the launch are marginally in profit. Those who bought at any point nearer $5.35 (the ATH) or bought during the 2025 rally will be significantly out of profit. These are the overhangs that tend to cause sell pressure on any strong rally.
The supply is as follows: The circulating supply is 4.01B SUI, out of a total and max supply of 10B. FDV is at 10.9B, compared to the circulating Mcap of 4.37B (2.49x ratio). There are 5.22B SUI set to be unlocked after 2030. This is the long-term dilution math headwind, though it is not short-term given when the unlock occurs.
The immediate trade structure
The chart shows a stark dichotomy. Price is consolidating in the rough $1.00-$1.10 range, and the first structurally significant level above that is $1.2851. A daily close above $1.2851 on persistent volume would first give us the confirmation that May’s rejection has been absorbed and not the endpoint. Until then, the default reading is a bounce within the larger downward trend.
On the negative side, the $1.00 psychological level represents the nearest support. Beneath that level, there is very little seen structure to the deeper $0.85-.90 February lows. That purple line at $0.5763 provides a distant but concrete target to a scenario of asset-specific weakness compounded by macro-risk-off.