Monad reached a major milestone in July, processing more than 107 million transactions, which will go down in history as a significant event. However, MON has been moving sideways just below the 50-day MA, after being rejected at this level multiple times.
July 2026 will be remembered as one of the months in which Monad hit a milestone. The network processed more than 107 million transactions, and this number has been increasing since March. In March the transaction processed was just above 50 million, and within a matter of just 4 months, it has more than doubled.
July’s record of 107.2 million transactions is a positive fundamental signal for Monad, as it suggests the network is experiencing growing adoption and stronger on-chain activity. Higher transaction volumes often indicate that more users and decentralized applications are interacting with the blockchain, which can increase demand for the network’s native token to pay transaction fees.
If this growth is driven by genuine user activity rather than temporary incentives or bot-generated transactions, it could improve investor confidence, attract more developers and capital to the ecosystem, and provide long-term support for the token’s price.
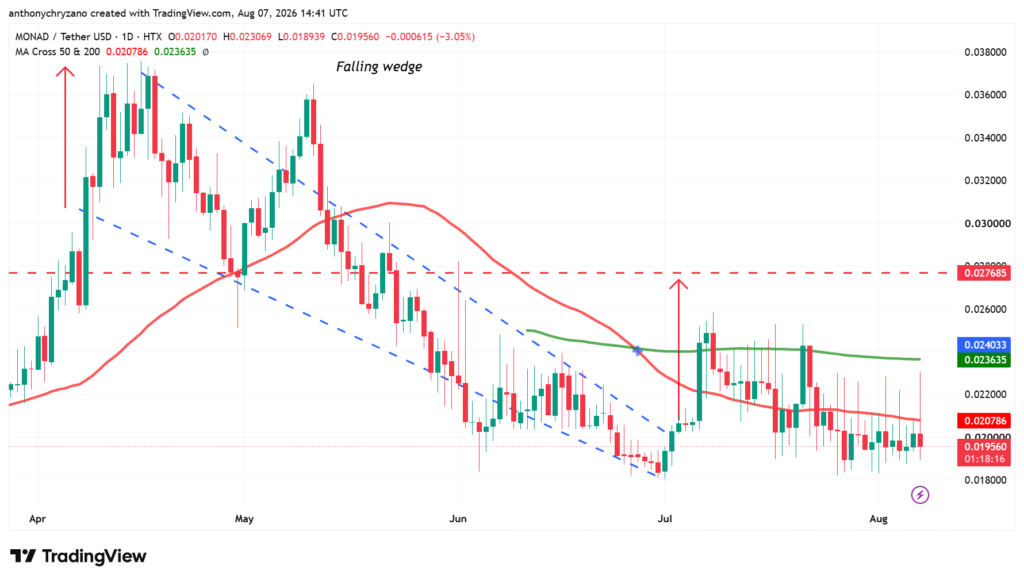
However, the chart above shows that the prices have not responded to this fundamental achievement. Usually when a token breaks out of a falling wedge, it immediately spikes and rises by the height of the wedge at the beginning of the formation. Unlike a conventional breakout, MON had a small spike, and thereafter it started to consolidate below the 200-day MA ($0.023), after which it lost the 50-day MA.
Currently candlesticks are getting smaller and smaller, and the wicks are getting bigger than the body. This indicates that buying and selling pressure is becoming more balanced, with neither bulls nor bears able to maintain control throughout each trading session. The long upper and lower wicks show that prices are being pushed higher and lower but are repeatedly rejected, reflecting indecision and heightened volatility.
As this continues, it often signals that the market is entering a period of consolidation before a stronger move. Traders typically watch for a breakout above resistance or below support, as the eventual move could determine the next significant price trend.